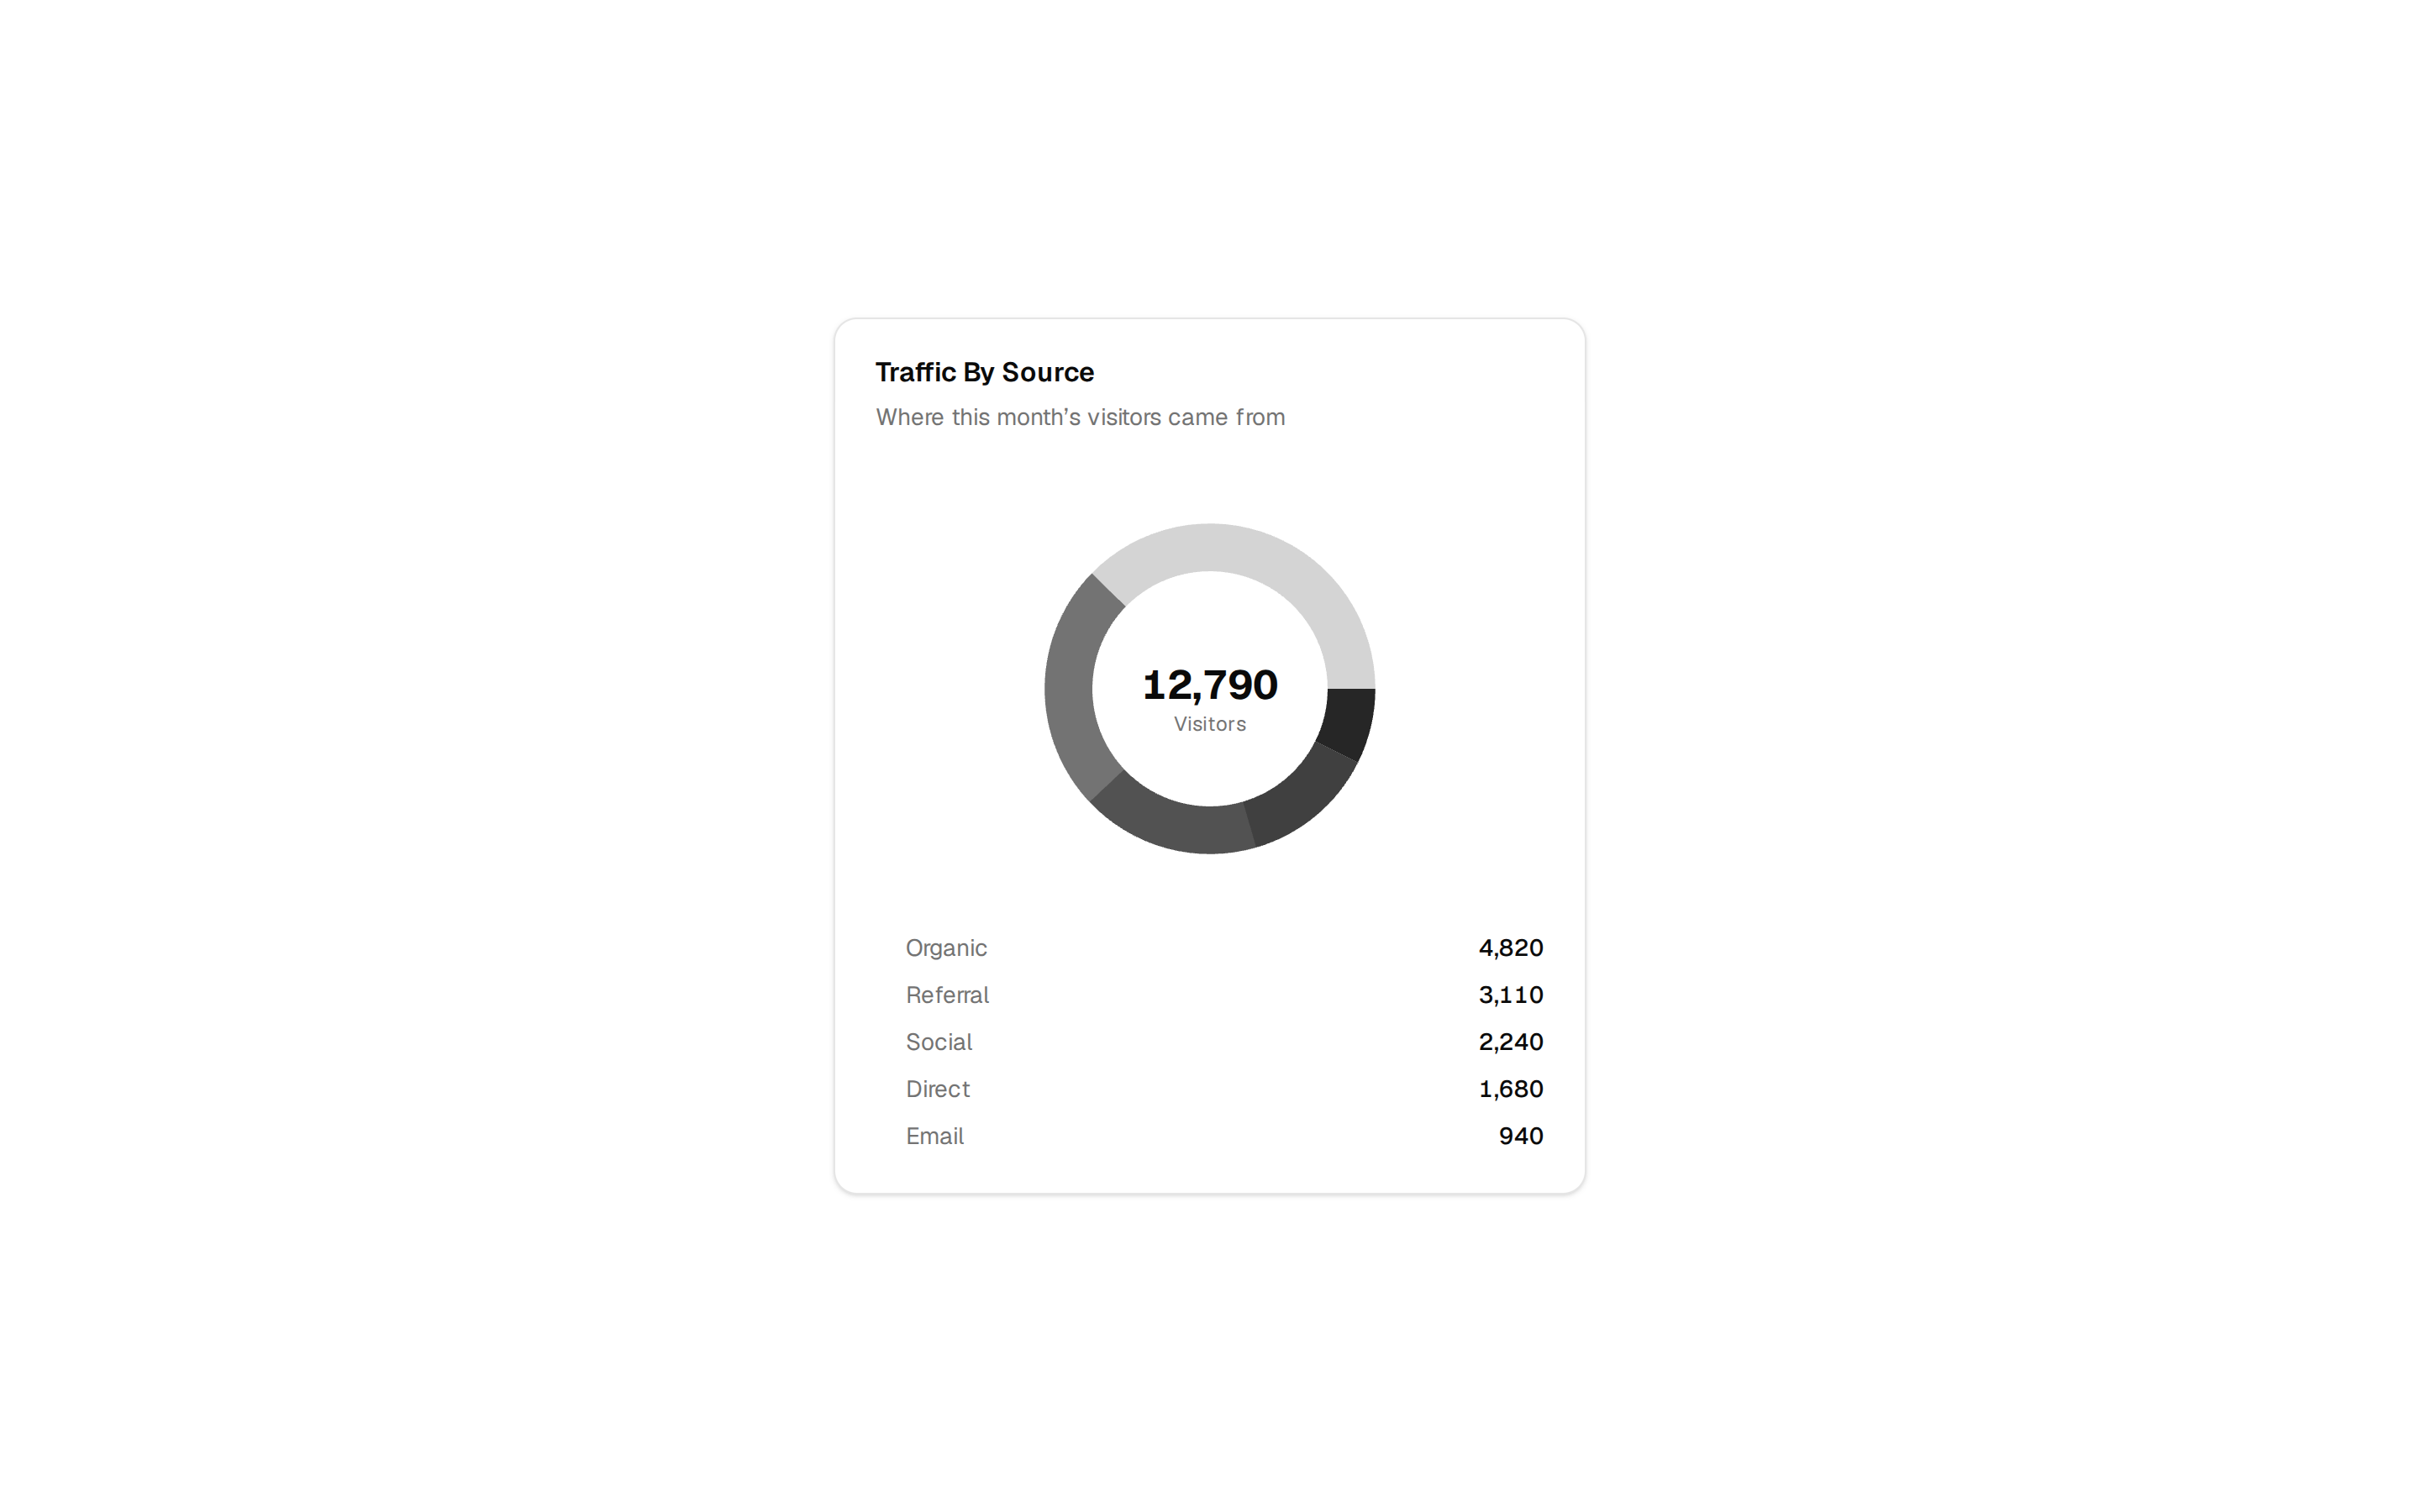
registry/base-nova/charts/chart-pie-occupancy.tsx
"use client"

import * as React from "react"
import { Label, Pie, PieChart } from "recharts"

import {
  Card,
  CardContent,
  CardDescription,
  CardFooter,
  CardHeader,
  CardTitle,
} from "@/components/ui/card"
import {
  ChartContainer,
  ChartTooltip,
  ChartTooltipContent,
  type ChartConfig,
} from "@/components/ui/chart"

export const description = "Bed occupancy, as a donut chart with the total"

// Beds right now, illustrative.
const chartData = [
  { status: "occupied", beds: 312, fill: "var(--color-occupied)" },
  { status: "cleaning", beds: 18, fill: "var(--color-cleaning)" },
  { status: "available", beds: 46, fill: "var(--color-available)" },
]

const chartConfig = {
  beds: {
    label: "Beds",
  },
  occupied: {
    label: "Occupied",
    color: "var(--chart-2)",
  },
  cleaning: {
    label: "Being cleaned",
    color: "var(--chart-4)",
  },
  available: {
    label: "Available",
    color: "var(--chart-1)",
  },
} satisfies ChartConfig

export function ChartPieOccupancy() {
  const total = React.useMemo(
    () => chartData.reduce((sum, { beds }) => sum + beds, 0),
    []
  )
  const occupied = Math.round((chartData[0]!.beds / total) * 100)
  return (
    <Card className="flex flex-col">
      <CardHeader className="items-center pb-0">
        <CardTitle>Bed occupancy</CardTitle>
        <CardDescription>All wards, now</CardDescription>
      </CardHeader>
      <CardContent className="flex-1 pb-0">
        <ChartContainer
          config={chartConfig}
          className="mx-auto aspect-square max-h-[250px]"
        >
          <PieChart>
            <ChartTooltip
              cursor={false}
              content={<ChartTooltipContent hideLabel />}
            />
            <Pie
              data={chartData}
              dataKey="beds"
              nameKey="status"
              innerRadius={60}
              strokeWidth={5}
            >
              <Label
                content={({ viewBox }) => {
                  if (viewBox && "cx" in viewBox && "cy" in viewBox) {
                    return (
                      <text
                        x={viewBox.cx}
                        y={viewBox.cy}
                        textAnchor="middle"
                        dominantBaseline="middle"
                      >
                        <tspan
                          x={viewBox.cx}
                          y={viewBox.cy}
                          className="fill-foreground text-3xl font-bold"
                        >
                          {occupied}%
                        </tspan>
                        <tspan
                          x={viewBox.cx}
                          y={(viewBox.cy || 0) + 24}
                          className="fill-muted-foreground"
                        >
                          occupied
                        </tspan>
                      </text>
                    )
                  }
                }}
              />
            </Pie>
          </PieChart>
        </ChartContainer>
      </CardContent>
      <CardFooter className="text-sm text-muted-foreground">
        {total} beds; illustrative data.
      </CardFooter>
    </Card>
  )
}