Active Users Area Trend
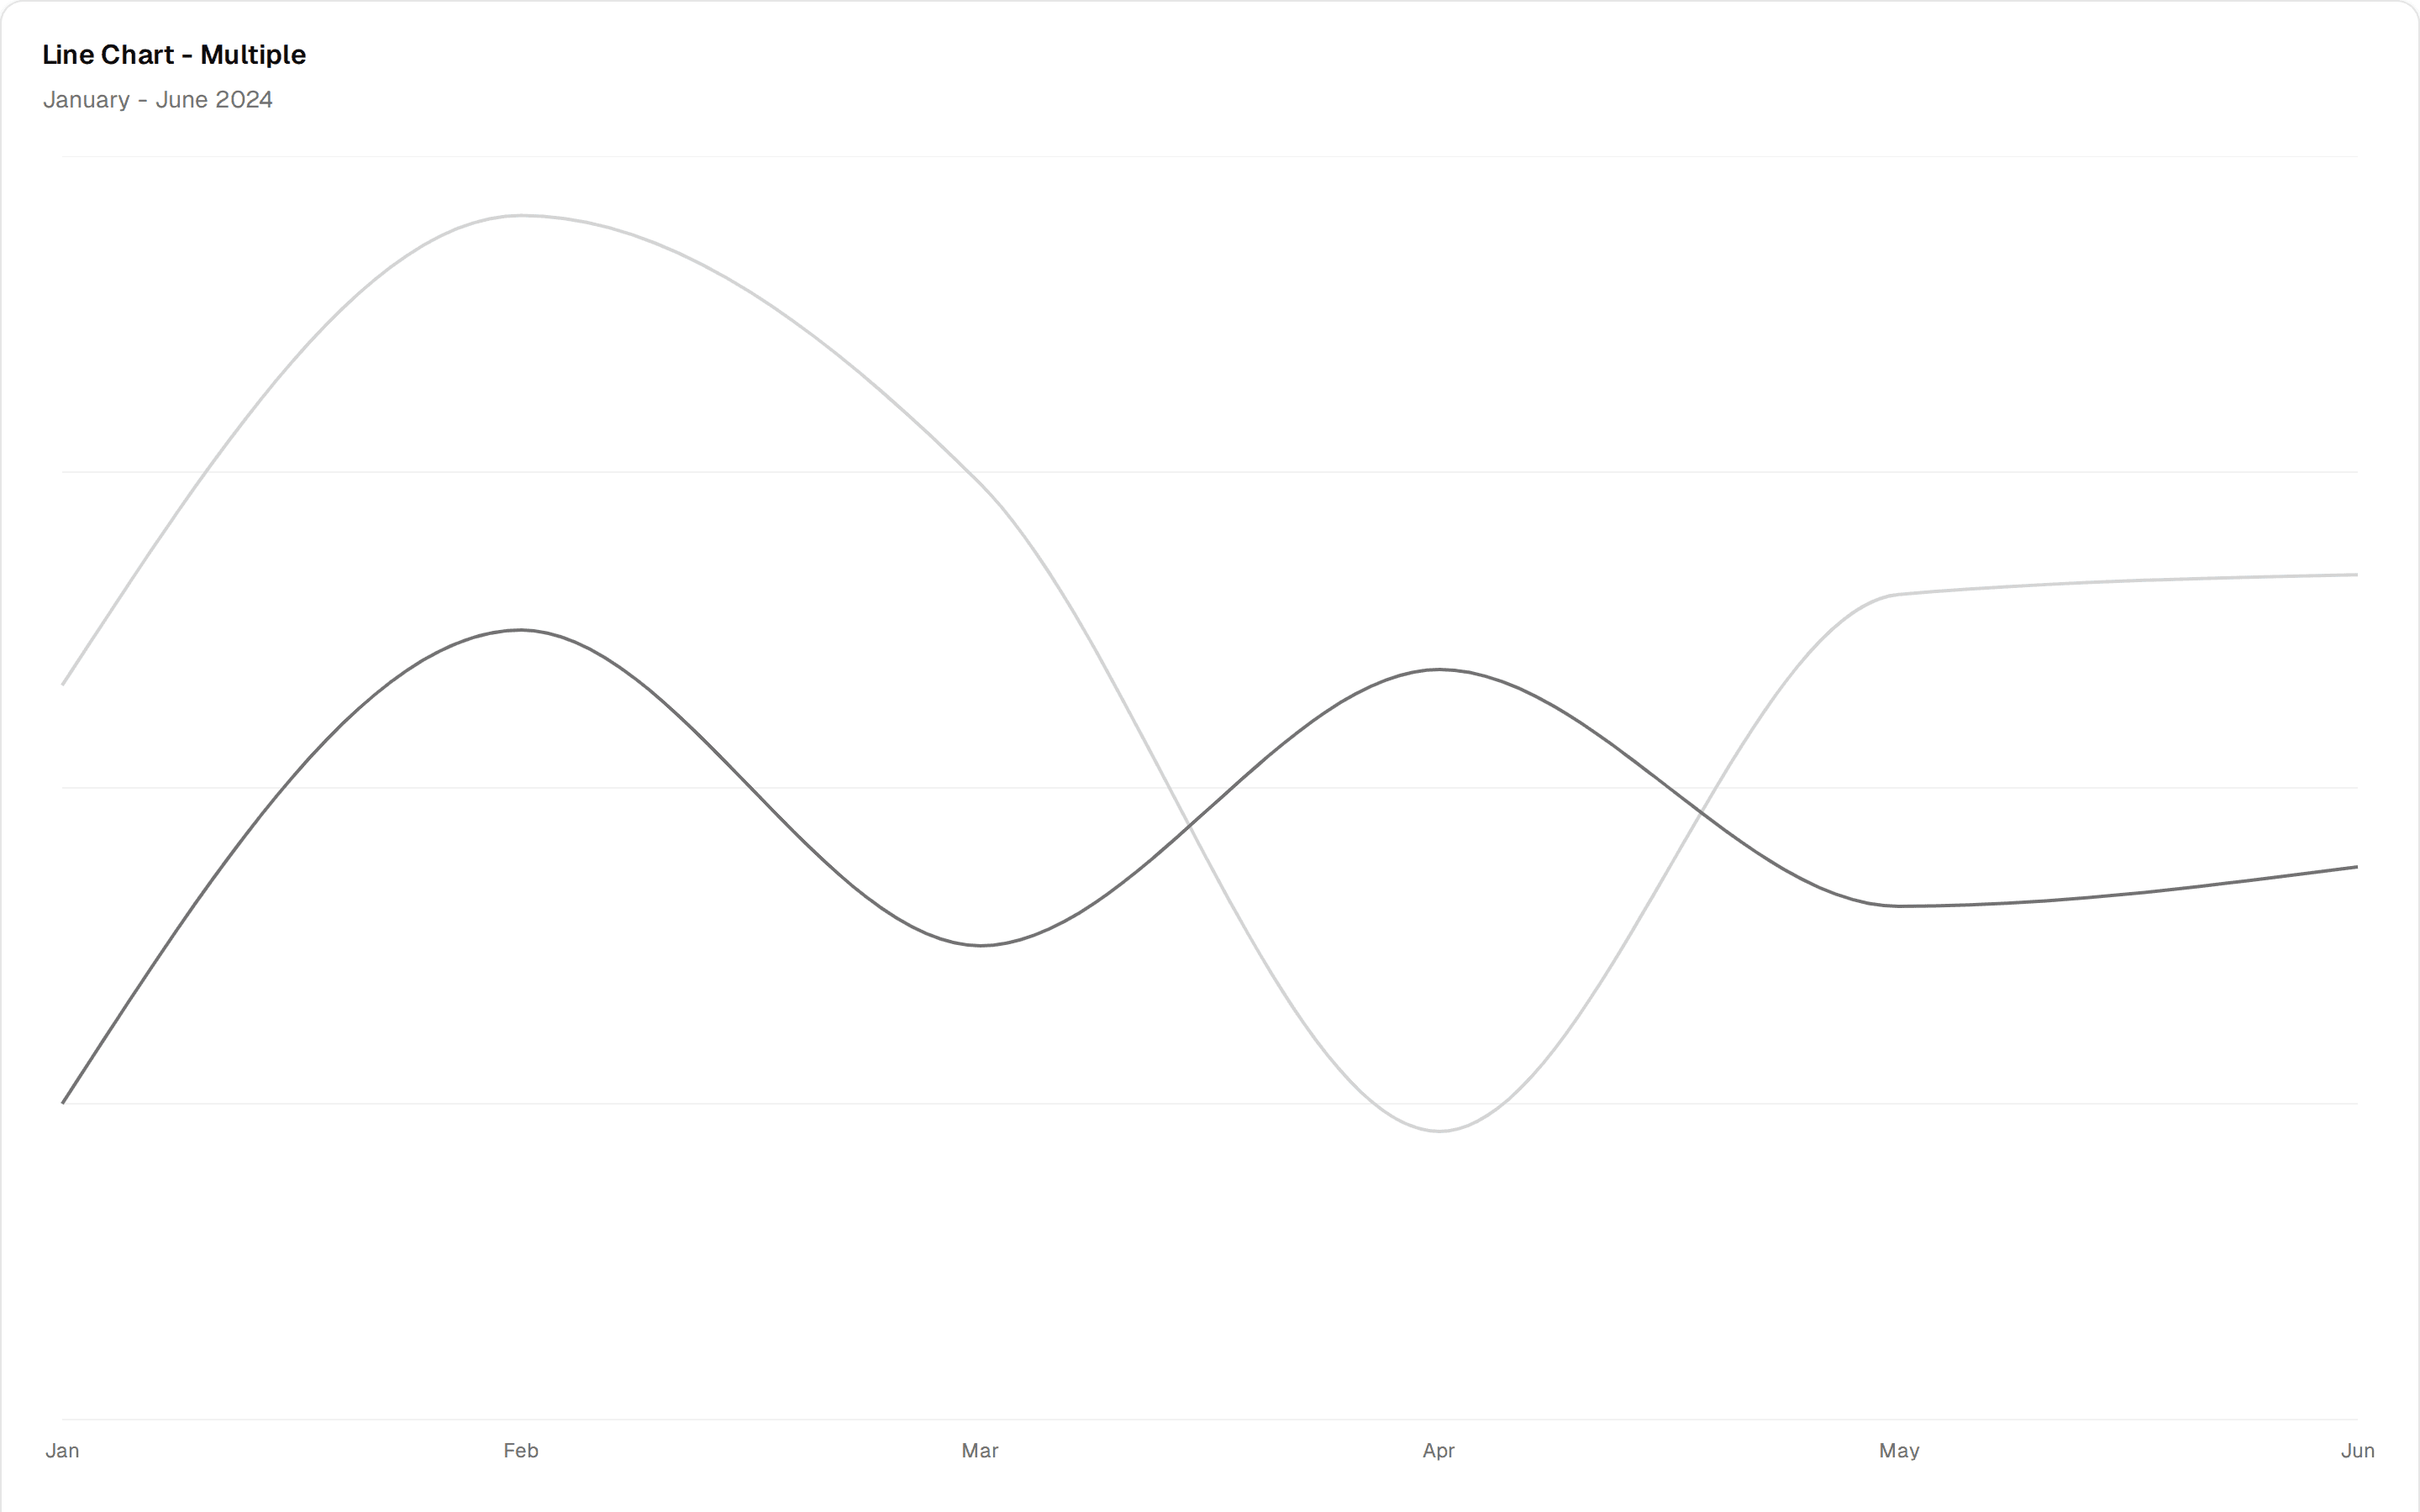
Gradient area chart of monthly active users, topped by a three KPI row (total, peak month, peak users) and a year over year growth badge.
@7ovr
Gradient area chart of monthly active users, topped by a three KPI row (total, peak month, peak users) and a year over year growth badge.
@7ovr
registry/blocks/charts/2/charts-block.tsx
"use client"

import { Area, AreaChart, CartesianGrid, XAxis } from "recharts"

import { Badge } from "@/components/ui/badge"
import {
  Card,
  CardContent,
  CardDescription,
  CardHeader,
  CardTitle,
} from "@/components/ui/card"
import {
  type ChartConfig,
  ChartContainer,
  ChartTooltip,
  ChartTooltipContent,
} from "@/components/ui/chart"

const chartData = [
  { month: "Jan", users: 11_240 },
  { month: "Feb", users: 13_870 },
  { month: "Mar", users: 12_580 },
  { month: "Apr", users: 16_340 },
  { month: "May", users: 19_120 },
  { month: "Jun", users: 22_490 },
  { month: "Jul", users: 20_870 },
  { month: "Aug", users: 25_630 },
  { month: "Sep", users: 28_140 },
  { month: "Oct", users: 31_760 },
  { month: "Nov", users: 29_980 },
  { month: "Dec", users: 35_210 },
]

const chartConfig = {
  users: {
    label: "Active Users",
    color: "var(--primary)",
  },
} satisfies ChartConfig

const totalUsers = chartData.reduce((sum, d) => sum + d.users, 0)
const peak = Math.max(...chartData.map((d) => d.users))
const peakMonth = chartData.find((d) => d.users === peak)?.month ?? ""
const growth = Math.round(
  ((chartData[11].users - chartData[0].users) / chartData[0].users) * 100
)

export default function ChartsBlock() {
  return (
    <section className="flex w-full items-center justify-center bg-background px-6 py-12 text-foreground">
      <Card className="w-full max-w-3xl">
        <CardHeader className="flex flex-row items-start justify-between gap-4">
          <div className="flex flex-col gap-1">
            <CardTitle className="text-lg">Monthly Active Users</CardTitle>
            <CardDescription>
              Acme Platform, rolling 12-month engagement trend
            </CardDescription>
          </div>
          <Badge variant="secondary" className="shrink-0 tabular-nums">
            +{growth}% YoY
          </Badge>
        </CardHeader>

        <CardContent className="flex flex-col gap-6">
          <div className="grid grid-cols-3 rounded-lg border border-border">
            <div className="flex flex-col gap-1 px-5 py-4">
              <span className="text-xs text-muted-foreground">Total Users</span>
              <span className="font-mono text-2xl font-semibold tabular-nums">
                {(totalUsers / 1_000).toFixed(1)}k
              </span>
            </div>
            <div className="flex flex-col gap-1 border-l border-border px-5 py-4">
              <span className="text-xs text-muted-foreground">Peak Month</span>
              <span className="font-mono text-2xl font-semibold tabular-nums">
                {peakMonth}
              </span>
            </div>
            <div className="flex flex-col gap-1 border-l border-border px-5 py-4">
              <span className="text-xs text-muted-foreground">Peak Users</span>
              <span className="font-mono text-2xl font-semibold tabular-nums">
                {(peak / 1_000).toFixed(1)}k
              </span>
            </div>
          </div>

          <ChartContainer
            config={chartConfig}
            className="h-56 w-full [&_.recharts-surface:focus-visible]:outline-2 [&_.recharts-surface:focus-visible]:outline-offset-2 [&_.recharts-surface:focus-visible]:outline-ring [&_.recharts-surface:focus-visible]:outline-solid"
          >
            <AreaChart
              aria-label="Active users by month"
              data={chartData}
              margin={{ left: 0, right: 0 }}
            >
              <defs>
                <linearGradient id="fillUsers" x1="0" y1="0" x2="0" y2="1">
                  <stop
                    offset="5%"
                    stopColor="var(--color-users)"
                    stopOpacity={0.3}
                  />
                  <stop
                    offset="95%"
                    stopColor="var(--color-users)"
                    stopOpacity={0}
                  />
                </linearGradient>
              </defs>
              <CartesianGrid vertical={false} />
              <XAxis
                dataKey="month"
                tickLine={false}
                axisLine={false}
                tickMargin={8}
              />
              <ChartTooltip
                cursor={false}
                content={
                  <ChartTooltipContent
                    formatter={(value) =>
                      Number(value).toLocaleString("en-US") + " users"
                    }
                  />
                }
              />
              <Area
                type="monotone"
                dataKey="users"
                stroke="var(--color-users)"
                strokeWidth={2}
                fill="url(#fillUsers)"
                dot={false}
                activeDot={{ r: 4, strokeWidth: 0 }}
              />
            </AreaChart>
          </ChartContainer>
        </CardContent>
      </Card>
    </section>
  )
}