Charts 3: small multiples
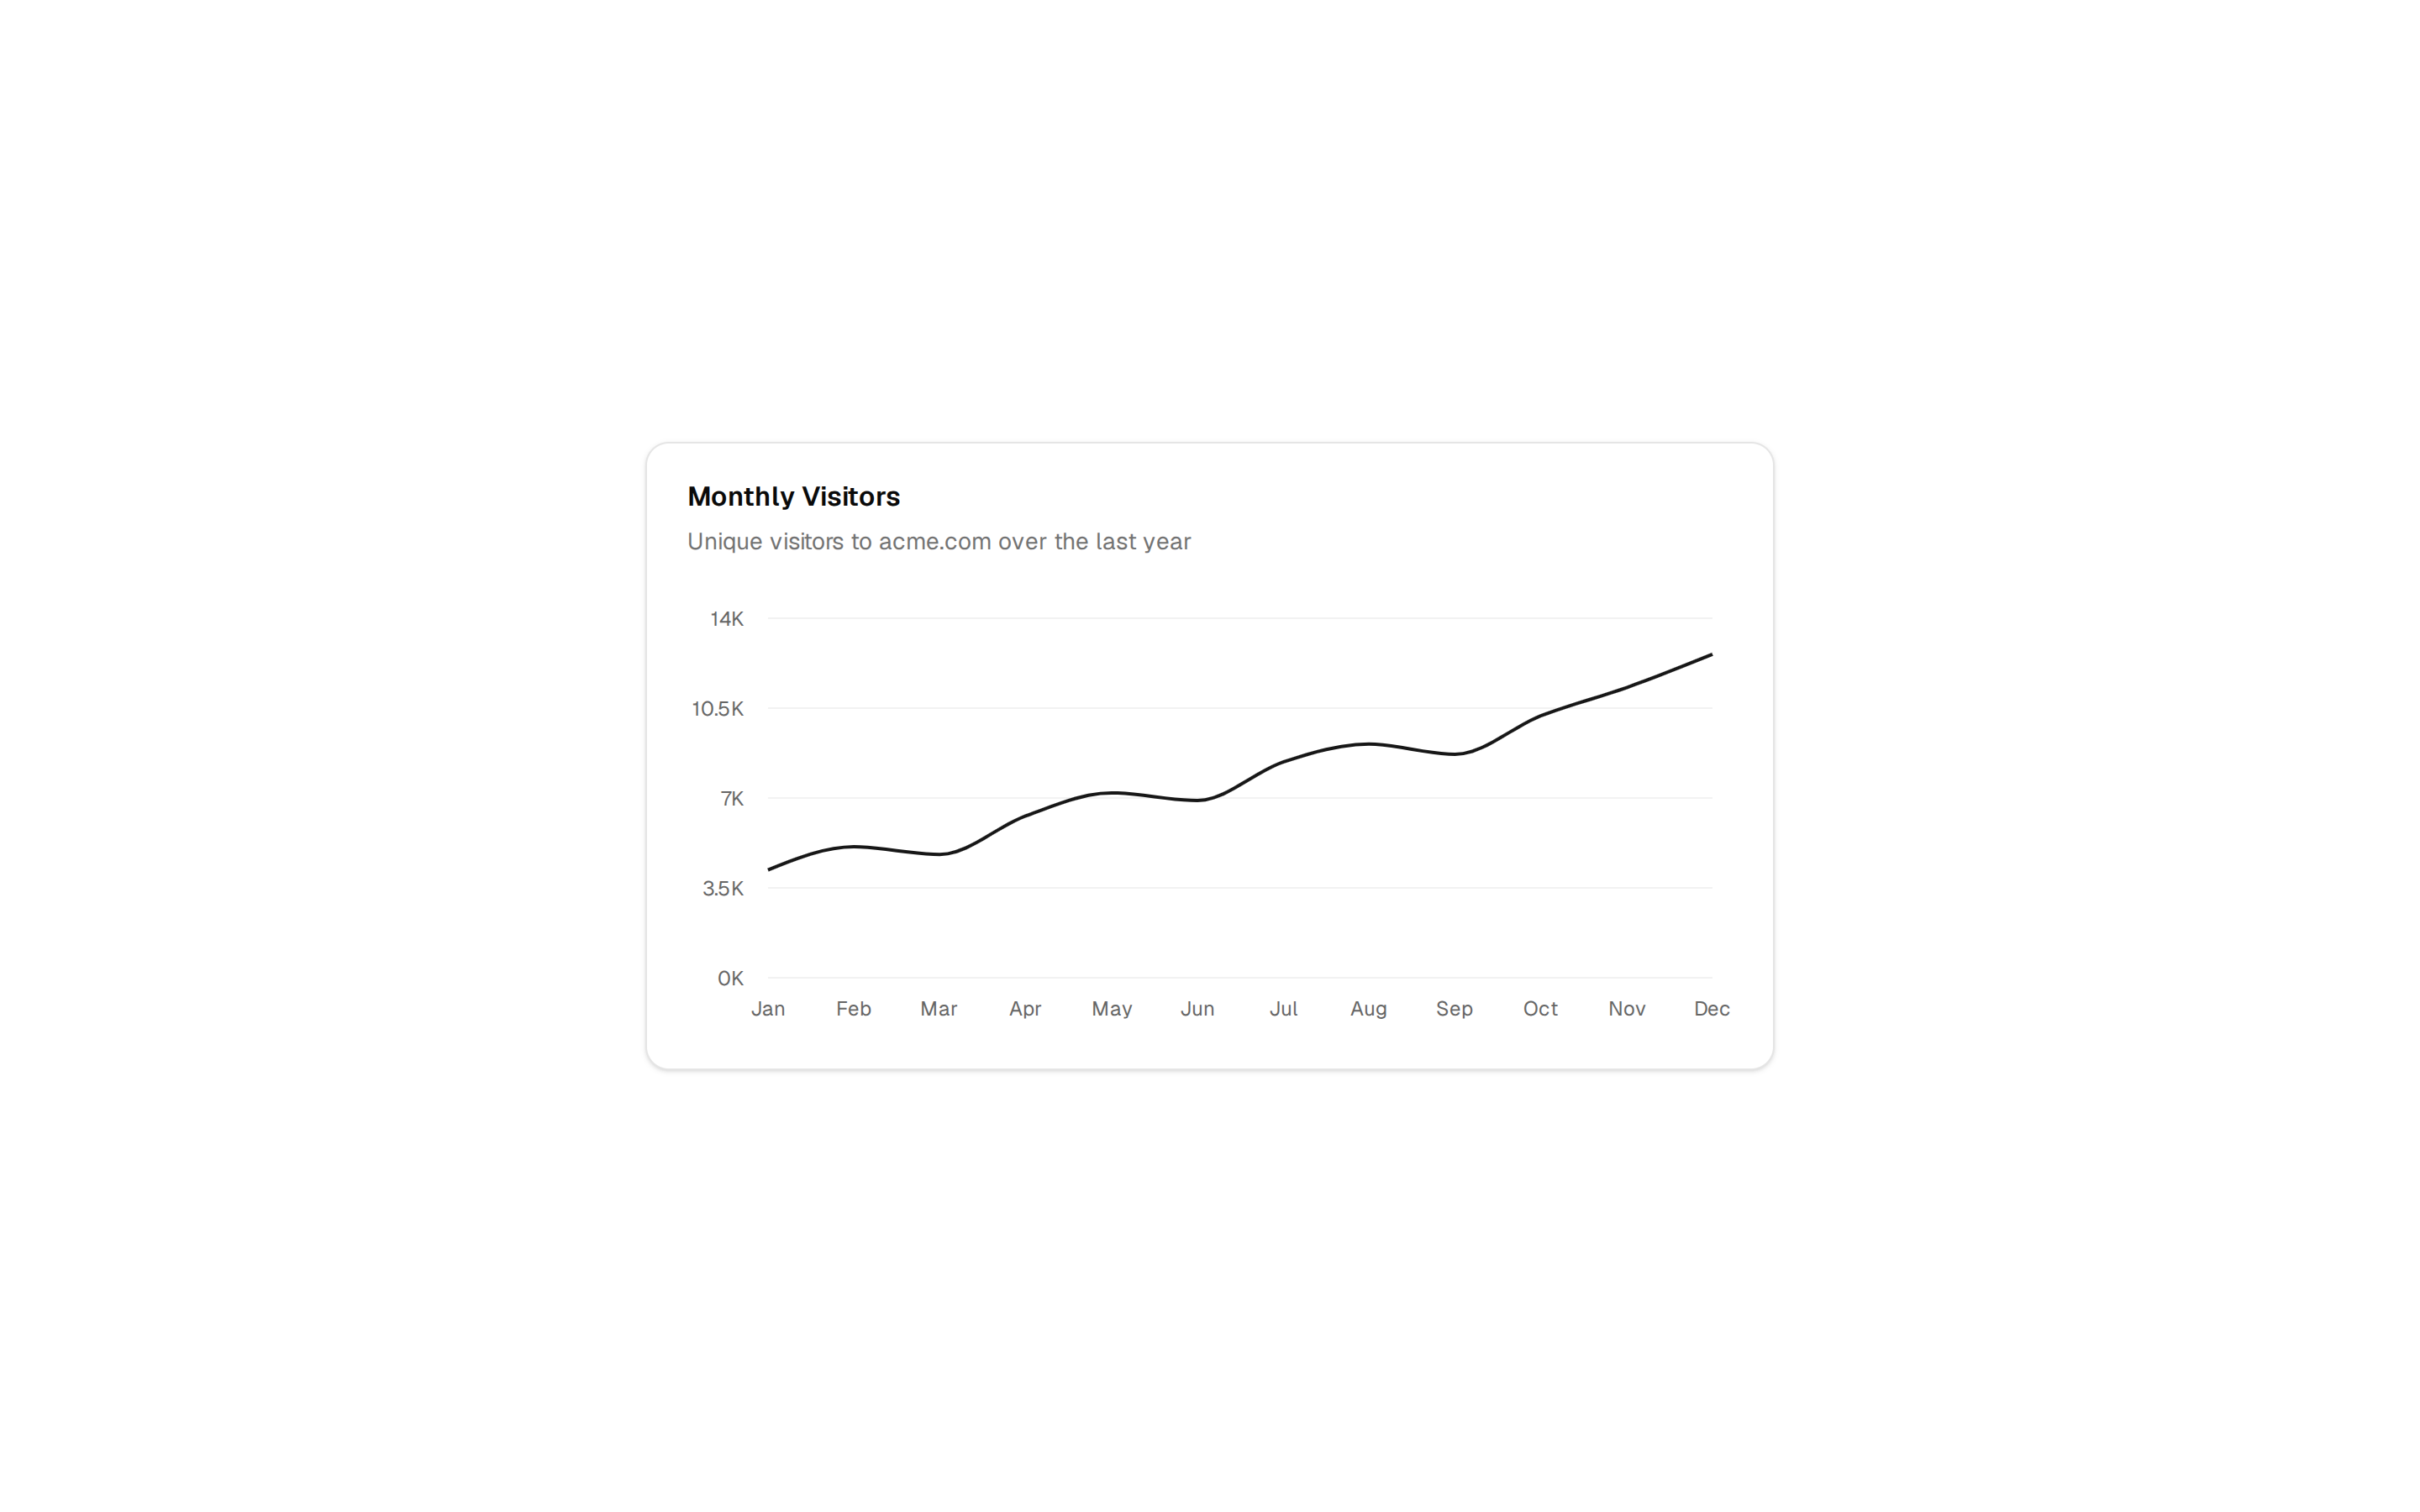
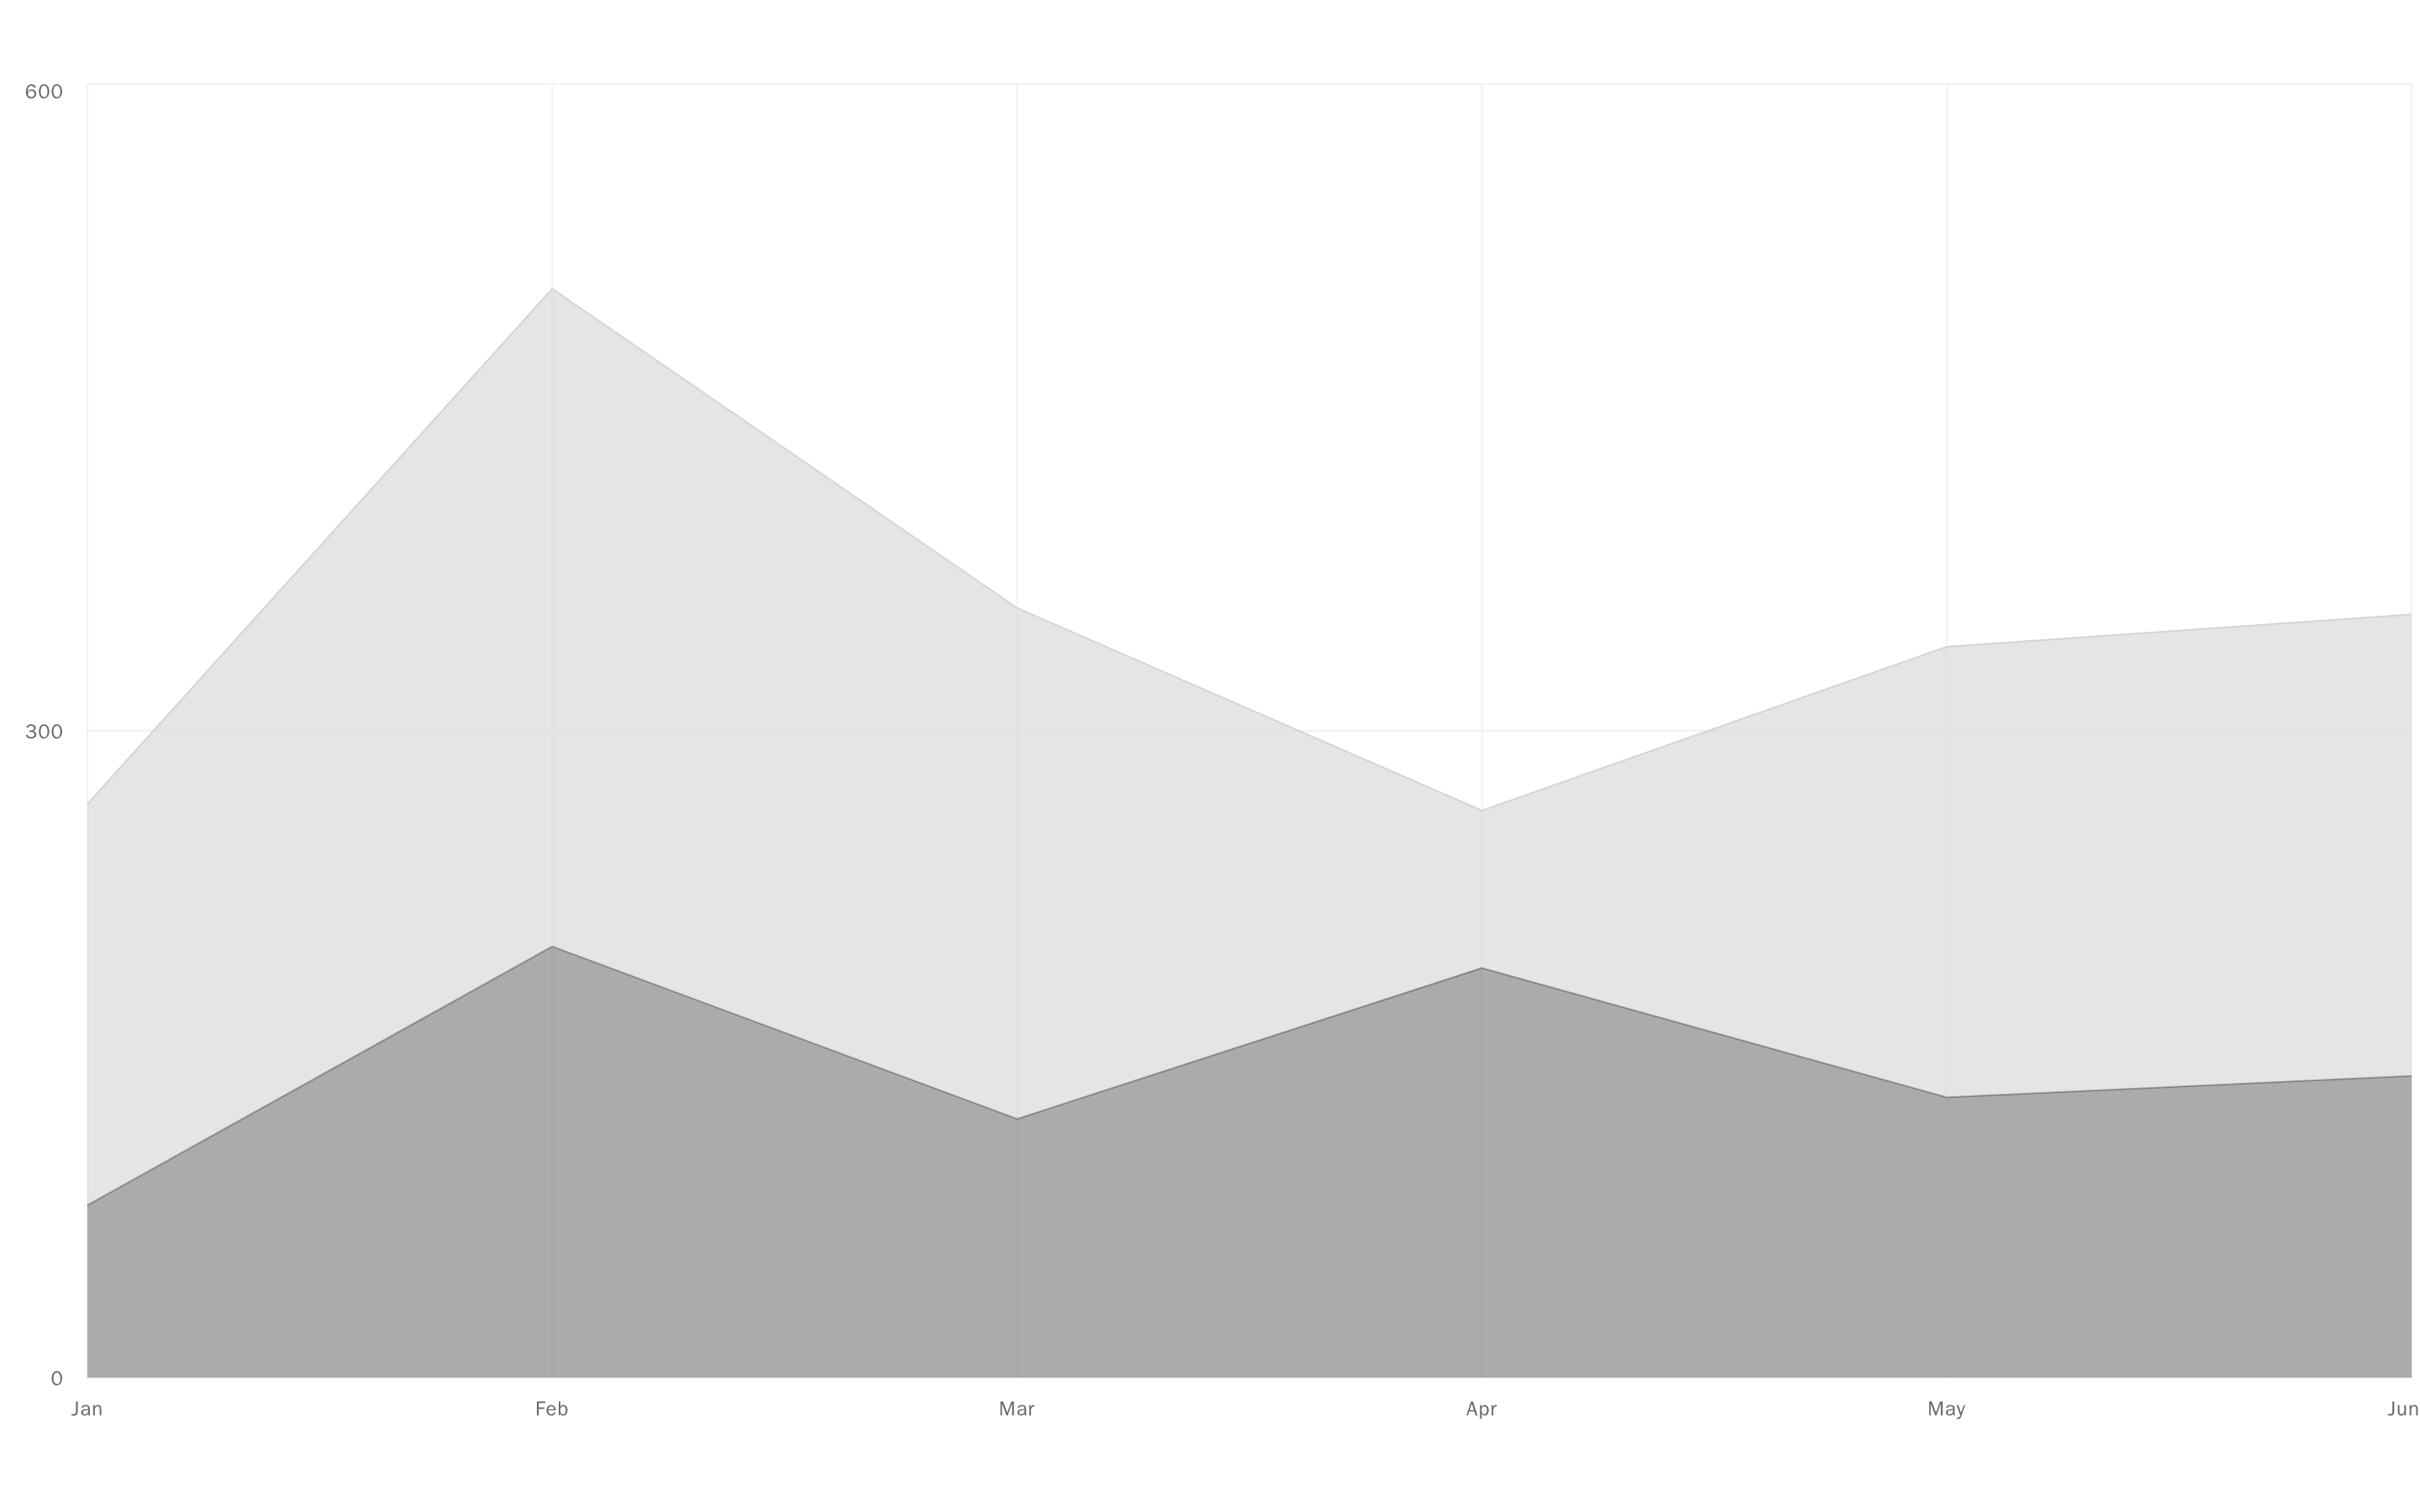
Small multiples: one small area chart per metric with the latest value, its change over the period in words and an arrow, which direction is good news, and a written summary for screen readers.
@ballmac
Small multiples: one small area chart per metric with the latest value, its change over the period in words and an arrow, which direction is good news, and a written summary for screen readers.
@ballmac
registry/ballmac/components/blocks/charts-3/charts-3.tsx
// Ballmac UI: Charts 3. https://ui.ballmac.com/blocks/charts-3
"use client"

import * as React from "react"
import { ArrowDown, ArrowUp, Gauge } from "lucide-react"
import { useReducedMotion } from "motion/react"
import { Area, AreaChart } from "recharts"

import { ChartContainer, ChartTooltip, ChartTooltipContent, type ChartConfig } from "@/components/ballmac/chart"
import { Skeleton } from "@/components/ballmac/skeleton"
import { frameProps, StateView, type StateProps } from "@/components/ballmac/state-view"
import { cn } from "@/lib/utils"

type Charts3Metric = {
  id: string
  label: string
  /** One value per period, oldest first. At least two. */
  values: number[]
  /** How the value is written. */
  format?: "number" | "currency" | "percent"
  /** Which direction is good news. A fall in refunds is good. */
  better?: "higher" | "lower"
}

type Charts3Props = Omit<React.ComponentProps<"section">, "title"> &
  StateProps & {
    title?: string
    description?: string
    /** The metrics to show, one small chart each. */
    metrics?: Charts3Metric[]
    /** What one value stands for, for the captions: "week". */
    period?: string
    currency?: string
    locale?: string
  }

const sample: Charts3Metric[] = [
  { id: "revenue", label: "Revenue", format: "currency", values: [41200, 43800, 42100, 46500, 48900, 47200, 52100, 54800, 53600, 58200, 61400, 63900] },
  { id: "orders", label: "Orders", values: [812, 846, 801, 903, 951, 934, 1012, 1068, 1041, 1130, 1187, 1224] },
  { id: "visitors", label: "Visitors", values: [18400, 19200, 18900, 20100, 21400, 21000, 22800, 23500, 23100, 24900, 25800, 26700] },
  { id: "conversion", label: "Conversion", format: "percent", values: [0.0441, 0.0439, 0.0424, 0.0449, 0.0444, 0.0445, 0.0444, 0.0454, 0.0451, 0.0454, 0.046, 0.0458] },
  { id: "refunds", label: "Refund rate", format: "percent", better: "lower", values: [0.031, 0.029, 0.034, 0.03, 0.028, 0.031, 0.027, 0.026, 0.029, 0.025, 0.024, 0.023] },
  { id: "tickets", label: "Support tickets", better: "lower", values: [214, 228, 241, 236, 219, 224, 207, 198, 205, 191, 186, 179] },
]

function Skel() {
  return (
    <div aria-hidden="true" className="grid grid-cols-1 gap-4 sm:grid-cols-2 lg:grid-cols-3">
      {Array.from({ length: 6 }, (_, i) => (
        <Skeleton key={i} className="h-40 rounded-xl" />
      ))}
    </div>
  )
}

function Tile({ metric, period, currency, locale }: { metric: Charts3Metric; period: string; currency: string; locale: string }) {
  const reduced = useReducedMotion()
  const id = React.useId().replace(/:/g, "")
  const write = React.useMemo(() => {
    const nf =
      metric.format === "currency"
        ? new Intl.NumberFormat(locale, { style: "currency", currency, maximumFractionDigits: 0 })
        : metric.format === "percent"
          ? new Intl.NumberFormat(locale, { style: "percent", minimumFractionDigits: 1, maximumFractionDigits: 1 })
          : new Intl.NumberFormat(locale)
    return (v: number) => nf.format(v)
  }, [metric.format, locale, currency])
  const change = React.useMemo(() => new Intl.NumberFormat(locale, { style: "percent", maximumFractionDigits: 1, signDisplay: "exceptZero" }), [locale])

  const first = metric.values[0]!
  const last = metric.values.at(-1)!
  const delta = first ? (last - first) / Math.abs(first) : 0
  const good = (metric.better ?? "higher") === "higher" ? delta >= 0 : delta <= 0
  const Arrow = delta >= 0 ? ArrowUp : ArrowDown
  const points = metric.values.map((value, i) => ({ n: i + 1, value }))
  const config = { value: { label: metric.label, color: "var(--chart-1)" } } satisfies ChartConfig
  const name = `${metric.label}, last ${metric.values.length} ${period}s`

  return (
    <li className="bg-card min-w-0 rounded-xl border p-4">
      <div className="flex items-start justify-between gap-3">
        <div className="min-w-0">
          <h2 className="text-muted-foreground truncate text-sm font-medium">{metric.label}</h2>
          <p className="mt-1 text-2xl font-semibold tracking-tight tabular-nums">{write(last)}</p>
        </div>
        <p className="flex items-center gap-1 text-xs font-medium tabular-nums">
          <Arrow aria-hidden="true" className={cn("size-3.5", good ? "text-chart-2" : "text-destructive")} />
          <span>{change.format(delta)}</span>
          <span className="sr-only">{good ? ", better" : ", worse"} than {metric.values.length - 1} {period}s ago</span>
        </p>
      </div>
      <ChartContainer
        config={config}
        label={name}
        summary={`${metric.label} went from ${write(first)} to ${write(last)} over ${metric.values.length} ${period}s, a change of ${change.format(delta)}. The highest was ${write(Math.max(...metric.values))} and the lowest ${write(Math.min(...metric.values))}.`}
        format={(v) => write(v)}
        className="mt-3 aspect-auto h-16 w-full"
        initialDimension={{ width: 240, height: 64 }}
      >
        <AreaChart data={points} margin={{ top: 4, right: 0, bottom: 0, left: 0 }} accessibilityLayer>
          <defs>
            <linearGradient id={`${id}-g`} x1="0" y1="0" x2="0" y2="1">
              <stop offset="5%" stopColor="var(--color-value)" stopOpacity={0.35} />
              <stop offset="95%" stopColor="var(--color-value)" stopOpacity={0.02} />
            </linearGradient>
          </defs>
          <ChartTooltip cursor={{ strokeDasharray: "3 3" }} content={<ChartTooltipContent hideLabel hideIndicator />} />
          <Area dataKey="value" type="monotone" stroke="var(--color-value)" strokeWidth={2} fill={`url(#${id}-g)`} dot={false} activeDot={{ r: 3.5 }} isAnimationActive={!reduced} animationDuration={600} />
        </AreaChart>
      </ChartContainer>
    </li>
  )
}

/**
 * Small multiples: one small chart per metric, all drawn the same way so they can be compared by eye. Each tile gives the latest value, its change over the
 * period in words as well as an arrow (and which way counts as better, so a fall in refunds reads as good news) and a sentence for screen readers.
 */
function Charts3({
  title = "Store health",
  description = "Six numbers that say whether the week went well.",
  metrics = sample,
  period = "week",
  currency = "USD",
  locale = "en",
  state = "ready",
  onRetry,
  emptyState,
  errorState,
  className,
  ...props
}: Charts3Props) {
  const id = React.useId()
  const list = state === "empty" ? [] : metrics.filter((m) => m.values.length >= 2)
  return (
    <section data-slot="charts-3" data-state={state} aria-labelledby={`${id}-title`} className={cn("mx-auto w-full max-w-5xl px-4 py-10 sm:px-6", className)} {...frameProps(props)}>
      <header className="mb-8">
        <h1 id={`${id}-title`} className="text-3xl font-semibold tracking-[-0.035em] text-balance">
          {title}
        </h1>
        <p className="text-muted-foreground mt-2 max-w-2xl text-pretty">{description}</p>
      </header>
      <StateView
        state={state === "empty" || !list.length ? "empty" : state === "loading" || state === "error" ? state : "ready"}
        onRetry={onRetry}
        label="Loading metrics"
        loading={<Skel />}
        empty={{ icon: <Gauge />, title: emptyState?.title ?? "No metrics yet", description: emptyState?.description ?? "Once there is a second period to compare, each metric gets a chart here.", action: emptyState?.action }}
        error={{ title: errorState?.title ?? "Metrics could not be loaded", description: errorState?.description ?? "Check your connection and try again.", ...errorState }}
      >
        <ul role="list" className="grid grid-cols-1 gap-4 sm:grid-cols-2 lg:grid-cols-3">
          {list.map((m) => (
            <Tile key={m.id} metric={m} period={period} currency={currency} locale={locale} />
          ))}
        </ul>
      </StateView>
    </section>
  )
}

export { Charts3, type Charts3Props, type Charts3Metric }