// Ballmac UI: Charts 1. https://ui.ballmac.com/blocks/charts-1
"use client"

import * as React from "react"
import { ArrowDown, ArrowUp, ChartNoAxesColumn } from "lucide-react"

import { ChartArea } from "@/components/ballmac/chart-area"
import { ChartBar } from "@/components/ballmac/chart-bar"
import { ChartPie } from "@/components/ballmac/chart-pie"
import { KpiItem, KpiRow } from "@/components/ballmac/kpi-row"
import { SegmentedControl, SegmentedControlItem } from "@/components/ballmac/segmented-control"
import { Skeleton } from "@/components/ballmac/skeleton"
import { frameProps, StateView, type StateProps } from "@/components/ballmac/state-view"
import { cn } from "@/lib/utils"

type Charts1Day = { date: string; newVisitors: number; returning: number; signups: number }
type Charts1Page = { page: string; views: number }
type Charts1Source = { name: string; label: string; value: number }

type Charts1Props = Omit<React.ComponentProps<"section">, "title"> &
  StateProps & {
    title?: string
    description?: string
    /** One row per day, oldest first, as ISO dates (2026-07-01). At least twice the longest range, so each range has a period to compare with. */
    daily?: Charts1Day[]
    /** Most viewed pages in the range. */
    pages?: Charts1Page[]
    /** Where visitors came from in the range. */
    sources?: Charts1Source[]
    /** The range shown at first: 7, 30 or 90 days. */
    defaultRange?: "7" | "30" | "90"
    /** Called when the range changes, so you can load that range's pages and sources. */
    onRangeChange?: (range: "7" | "30" | "90") => void
    locale?: string
  }

// Sample data, worked out from the day number so the server and the browser agree.
const start = Date.UTC(2026, 3, 1)
const sampleDaily: Charts1Day[] = Array.from({ length: 180 }, (_, i) => {
  const date = new Date(start + i * 86_400_000)
  const weekend = [0, 6].includes(date.getUTCDay())
  const newVisitors = Math.round(300 + i * 2.6 + Math.sin(i / 3.1) * 42 - (weekend ? 70 : 0))
  const returning = Math.round(190 + i * 1.7 + Math.cos(i / 4.3) * 31 + (weekend ? 18 : 0))
  return { date: date.toISOString().slice(0, 10), newVisitors, returning, signups: Math.round((newVisitors + returning) * (0.034 + Math.sin(i / 9) * 0.004)) }
})
const samplePages: Charts1Page[] = [
  { page: "/pricing", views: 18420 },
  { page: "/docs/get-started", views: 15310 },
  { page: "/blocks", views: 12980 },
  { page: "/components/button", views: 9640 },
  { page: "/themes", views: 7220 },
]
const sampleSources: Charts1Source[] = [
  { name: "search", label: "Search", value: 4210 },
  { name: "direct", label: "Direct", value: 2890 },
  { name: "social", label: "Social", value: 1630 },
  { name: "email", label: "Email", value: 980 },
]

const sum = (rows: Charts1Day[], pick: (d: Charts1Day) => number) => rows.reduce((total, d) => total + pick(d), 0)

function Skel() {
  return (
    <div aria-hidden="true" className="grid gap-6">
      <Skeleton className="h-24 rounded-xl" />
      <Skeleton className="aspect-[2/1] w-full rounded-xl" />
      <div className="grid gap-6 lg:grid-cols-2">
        <Skeleton className="h-72 rounded-xl" />
        <Skeleton className="h-72 rounded-xl" />
      </div>
    </div>
  )
}

/**
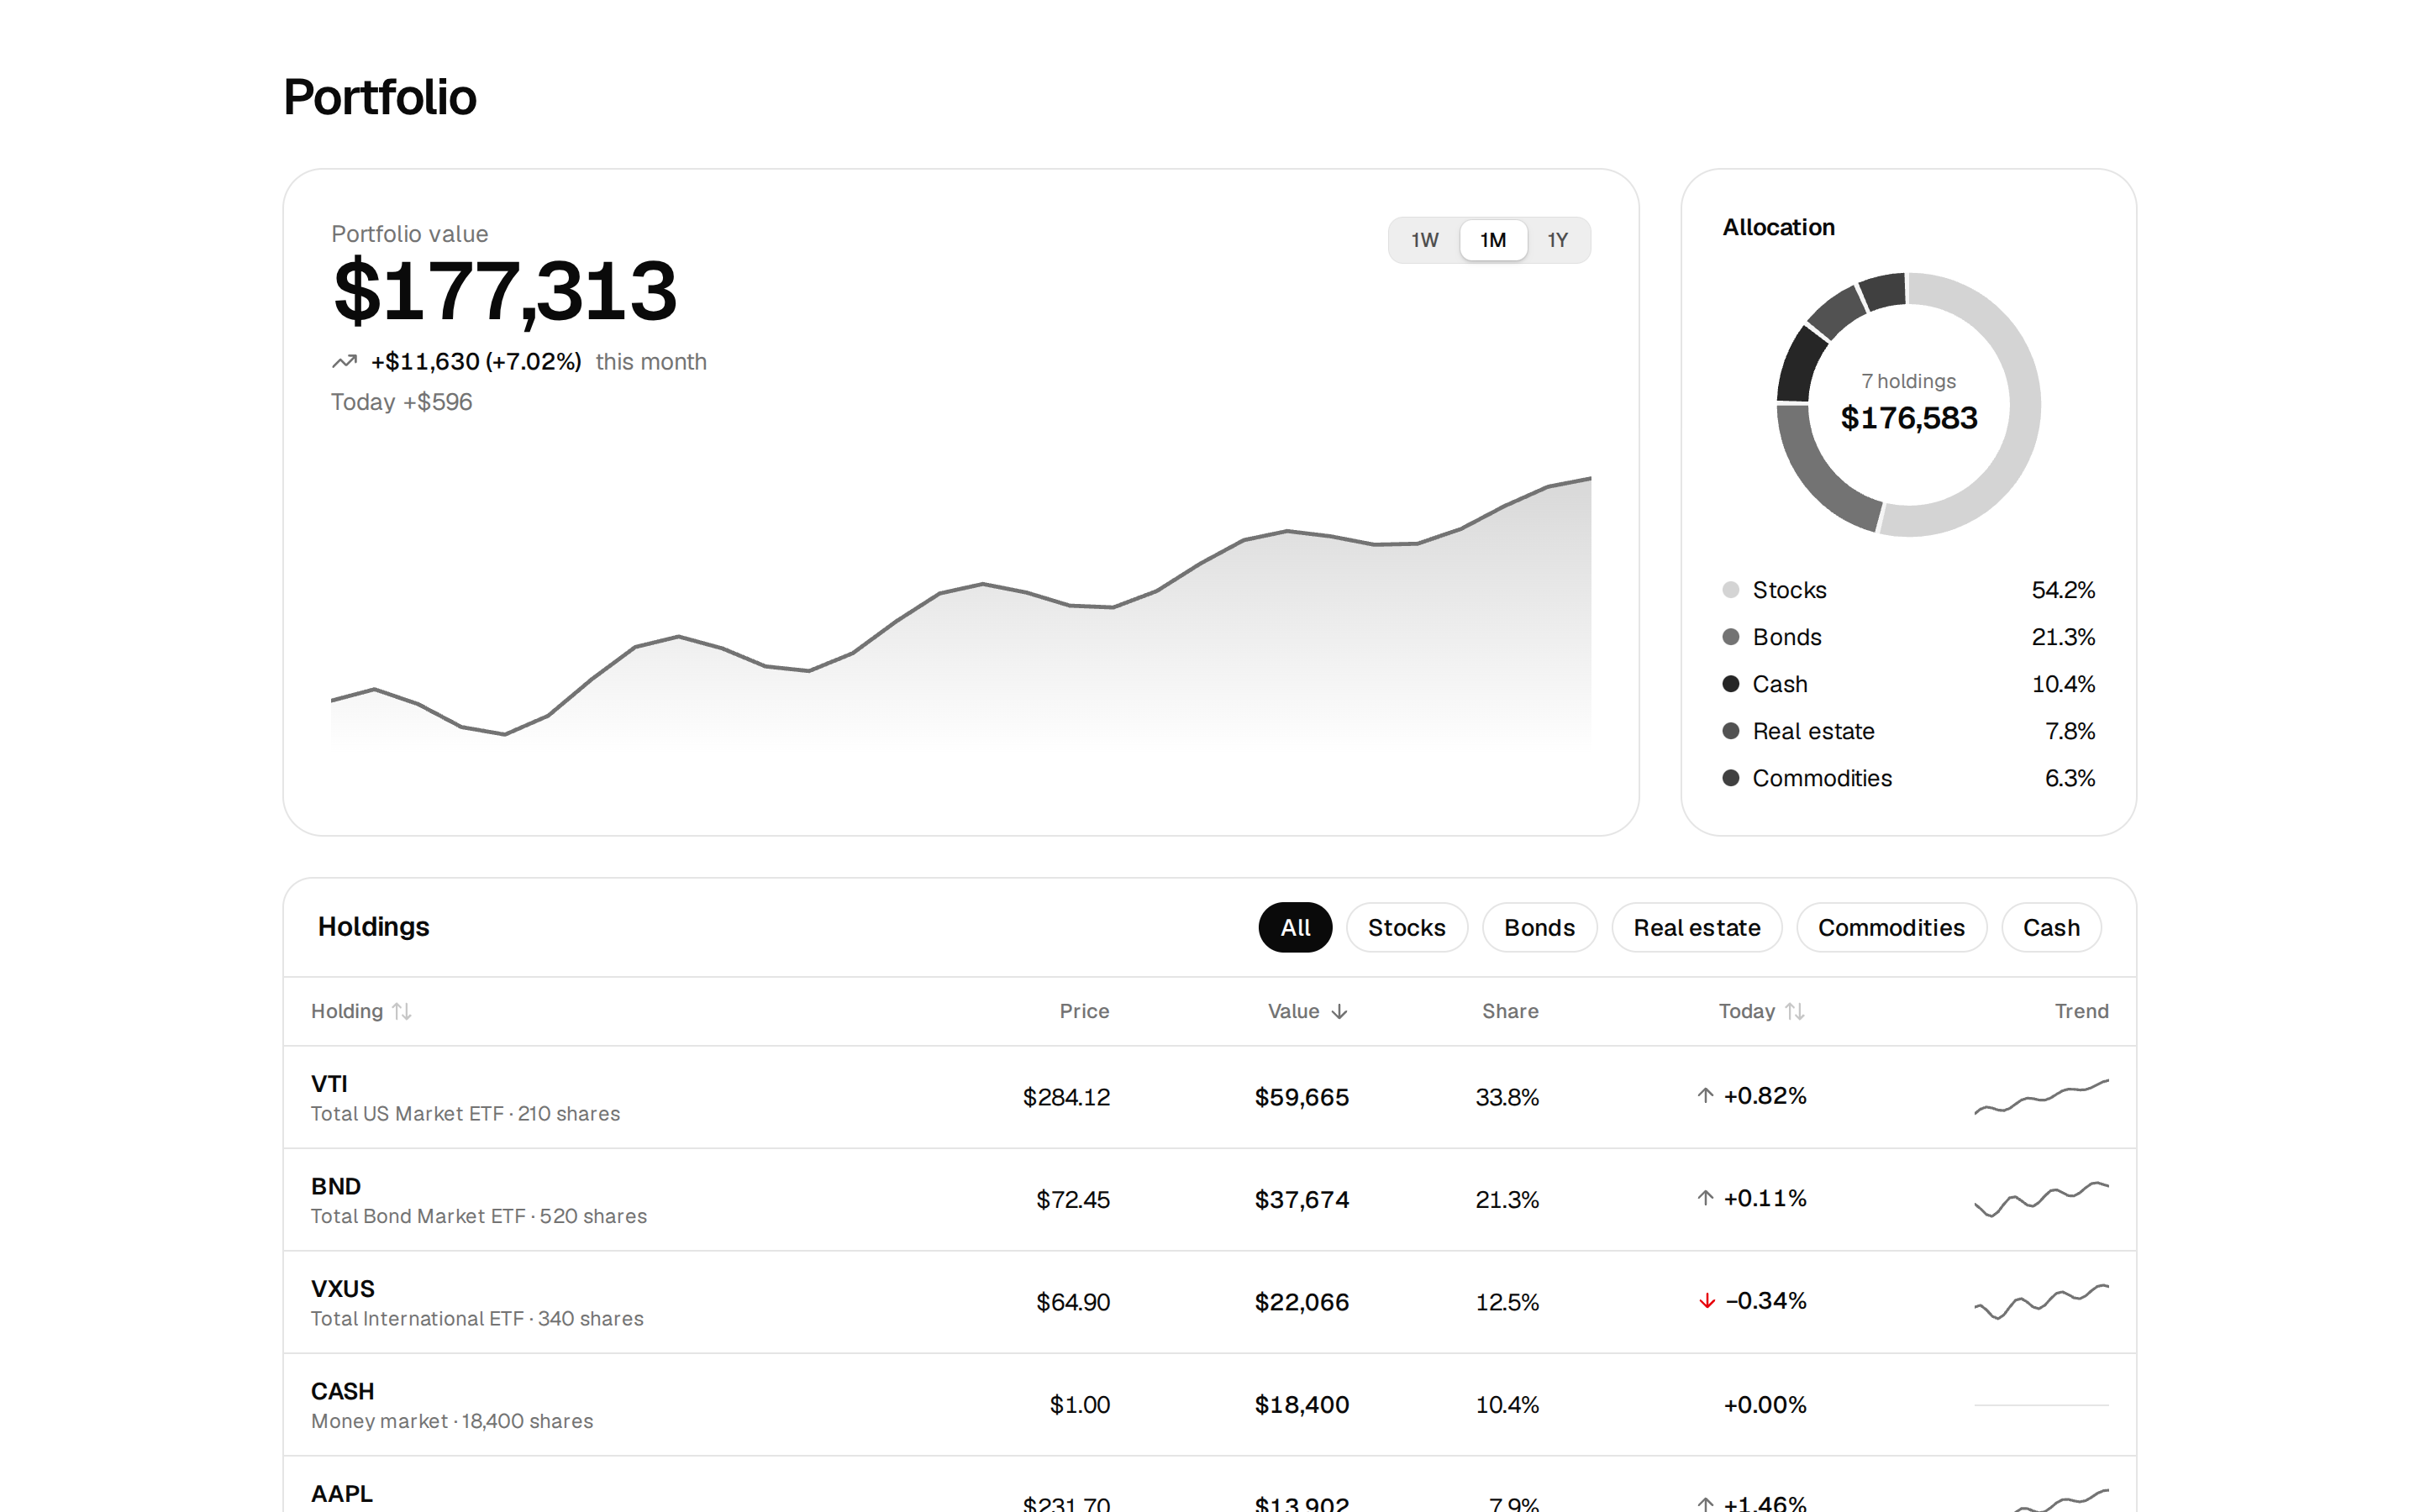
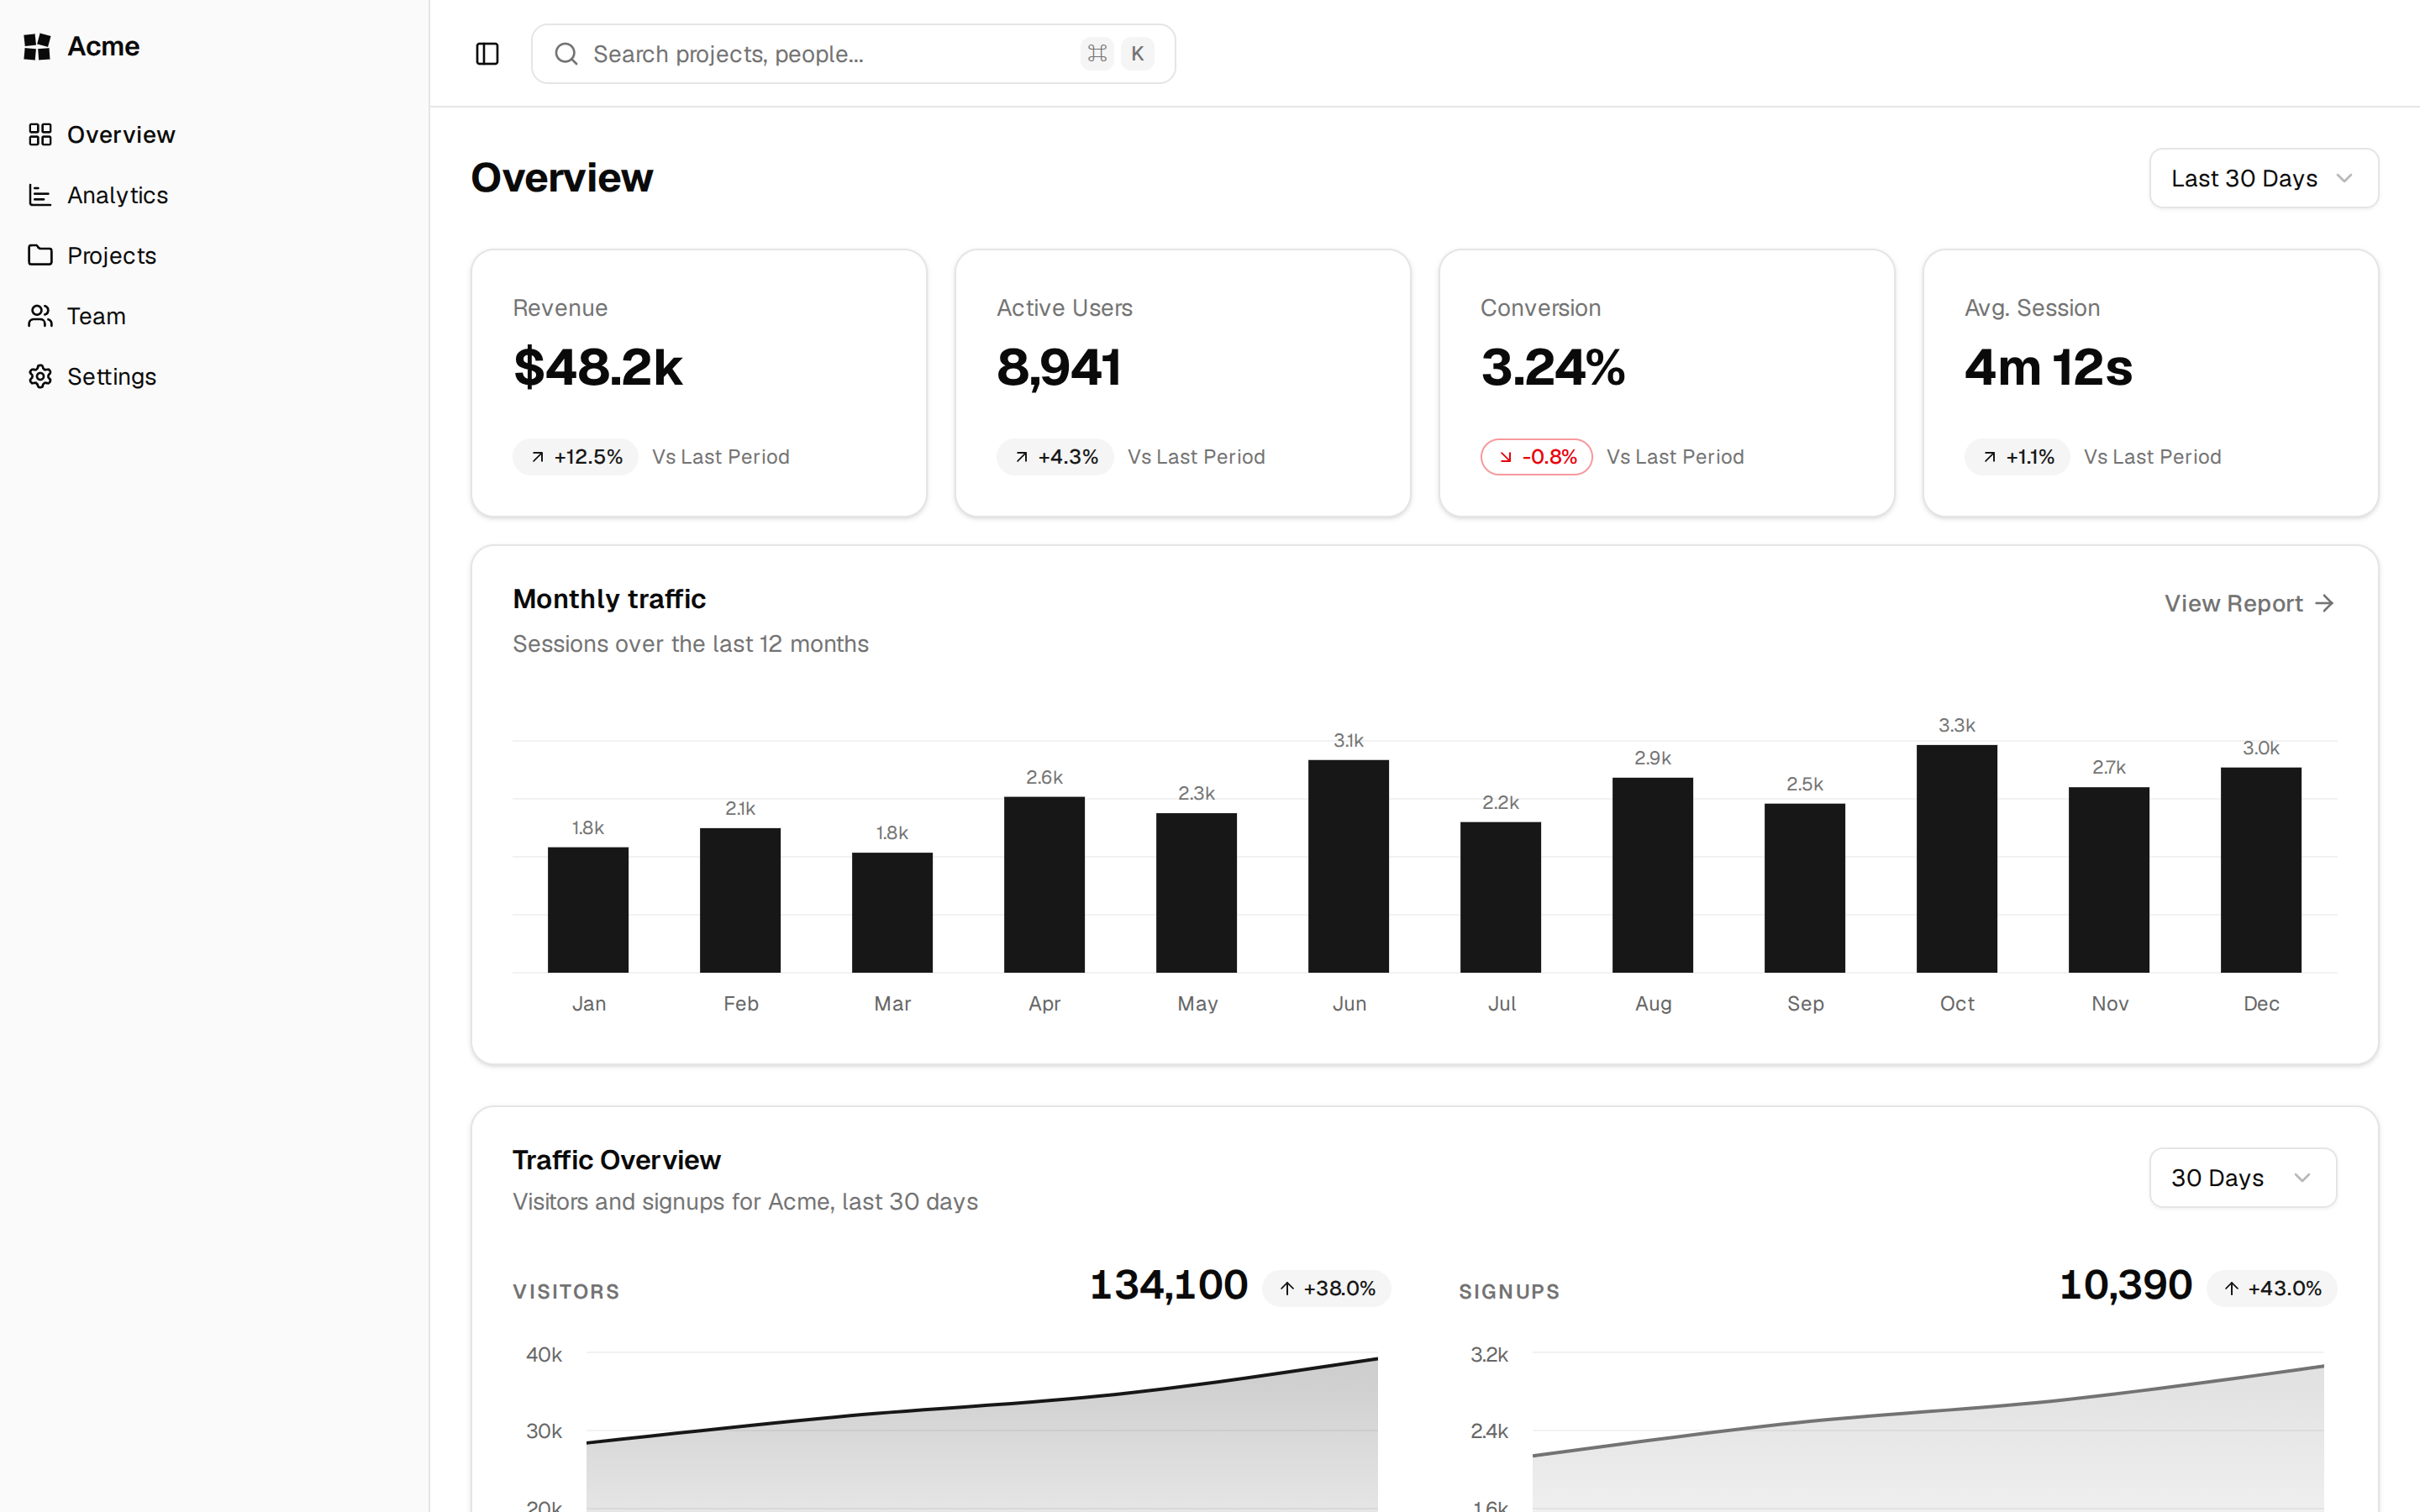
 * An analytics overview: a range picker, four figures with their change from the period before, an area chart of new and returning visitors, the
 * top pages and where visitors came from. Every figure is worked out from the daily rows, and each chart has a table view and a CSV download.
 */
function Charts1({
  title = "Analytics",
  description = "How many people visit, where they come from and what they read.",
  daily = sampleDaily,
  pages = samplePages,
  sources = sampleSources,
  defaultRange = "30",
  onRangeChange,
  locale = "en",
  state = "ready",
  onRetry,
  emptyState,
  errorState,
  className,
  ...props
}: Charts1Props) {
  const id = React.useId()
  const [range, setRange] = React.useState<"7" | "30" | "90">(defaultRange)
  const days = Number(range)
  const rows = state === "empty" ? [] : daily
  const current = rows.slice(-days)
  const before = rows.slice(-days * 2, -days)
  const n = React.useMemo(() => new Intl.NumberFormat(locale), [locale])
  const pct = React.useMemo(() => new Intl.NumberFormat(locale, { style: "percent", maximumFractionDigits: 1 }), [locale])
  const change = React.useMemo(() => new Intl.NumberFormat(locale, { style: "percent", maximumFractionDigits: 1, signDisplay: "exceptZero" }), [locale])
  const day = React.useMemo(() => new Intl.DateTimeFormat(locale, { month: "short", day: "numeric", timeZone: "UTC" }), [locale])

  const figures = React.useMemo(() => {
    const visitors = (d: Charts1Day) => d.newVisitors + d.returning
    const figs = [
      { label: "Visitors", now: sum(current, visitors), prev: sum(before, visitors), write: (v: number) => n.format(v) },
      { label: "Sign-ups", now: sum(current, (d) => d.signups), prev: sum(before, (d) => d.signups), write: (v: number) => n.format(v) },
      { label: "Conversion", now: sum(current, (d) => d.signups) / (sum(current, visitors) || 1), prev: sum(before, (d) => d.signups) / (sum(before, visitors) || 1), write: (v: number) => pct.format(v) },
      { label: "Returning", now: sum(current, (d) => d.returning) / (sum(current, visitors) || 1), prev: sum(before, (d) => d.returning) / (sum(before, visitors) || 1), write: (v: number) => pct.format(v) },
    ]
    return figs.map((f) => ({ ...f, delta: before.length && f.prev ? (f.now - f.prev) / f.prev : null }))
  }, [current, before, n, pct])

  const content = !current.length ? null : (
    <div className="grid gap-6">
      <KpiRow columns={4} className="w-full">
        {figures.map((f) => (
          <KpiItem
            key={f.label}
            label={f.label}
            value={f.write(f.now)}
            detail={
              f.delta === null ? (
                "No earlier period to compare"
              ) : (
                <span className="inline-flex items-center gap-1">
                  {f.delta >= 0 ? <ArrowUp aria-hidden="true" className="size-3.5 text-chart-2" /> : <ArrowDown aria-hidden="true" className="text-destructive size-3.5" />}
                  <span className="text-foreground font-medium tabular-nums">{change.format(f.delta)}</span>
                  <span className="sr-only">{f.delta >= 0 ? " up" : " down"}</span> vs the previous {days} days
                </span>
              )
            }
          />
        ))}
      </KpiRow>

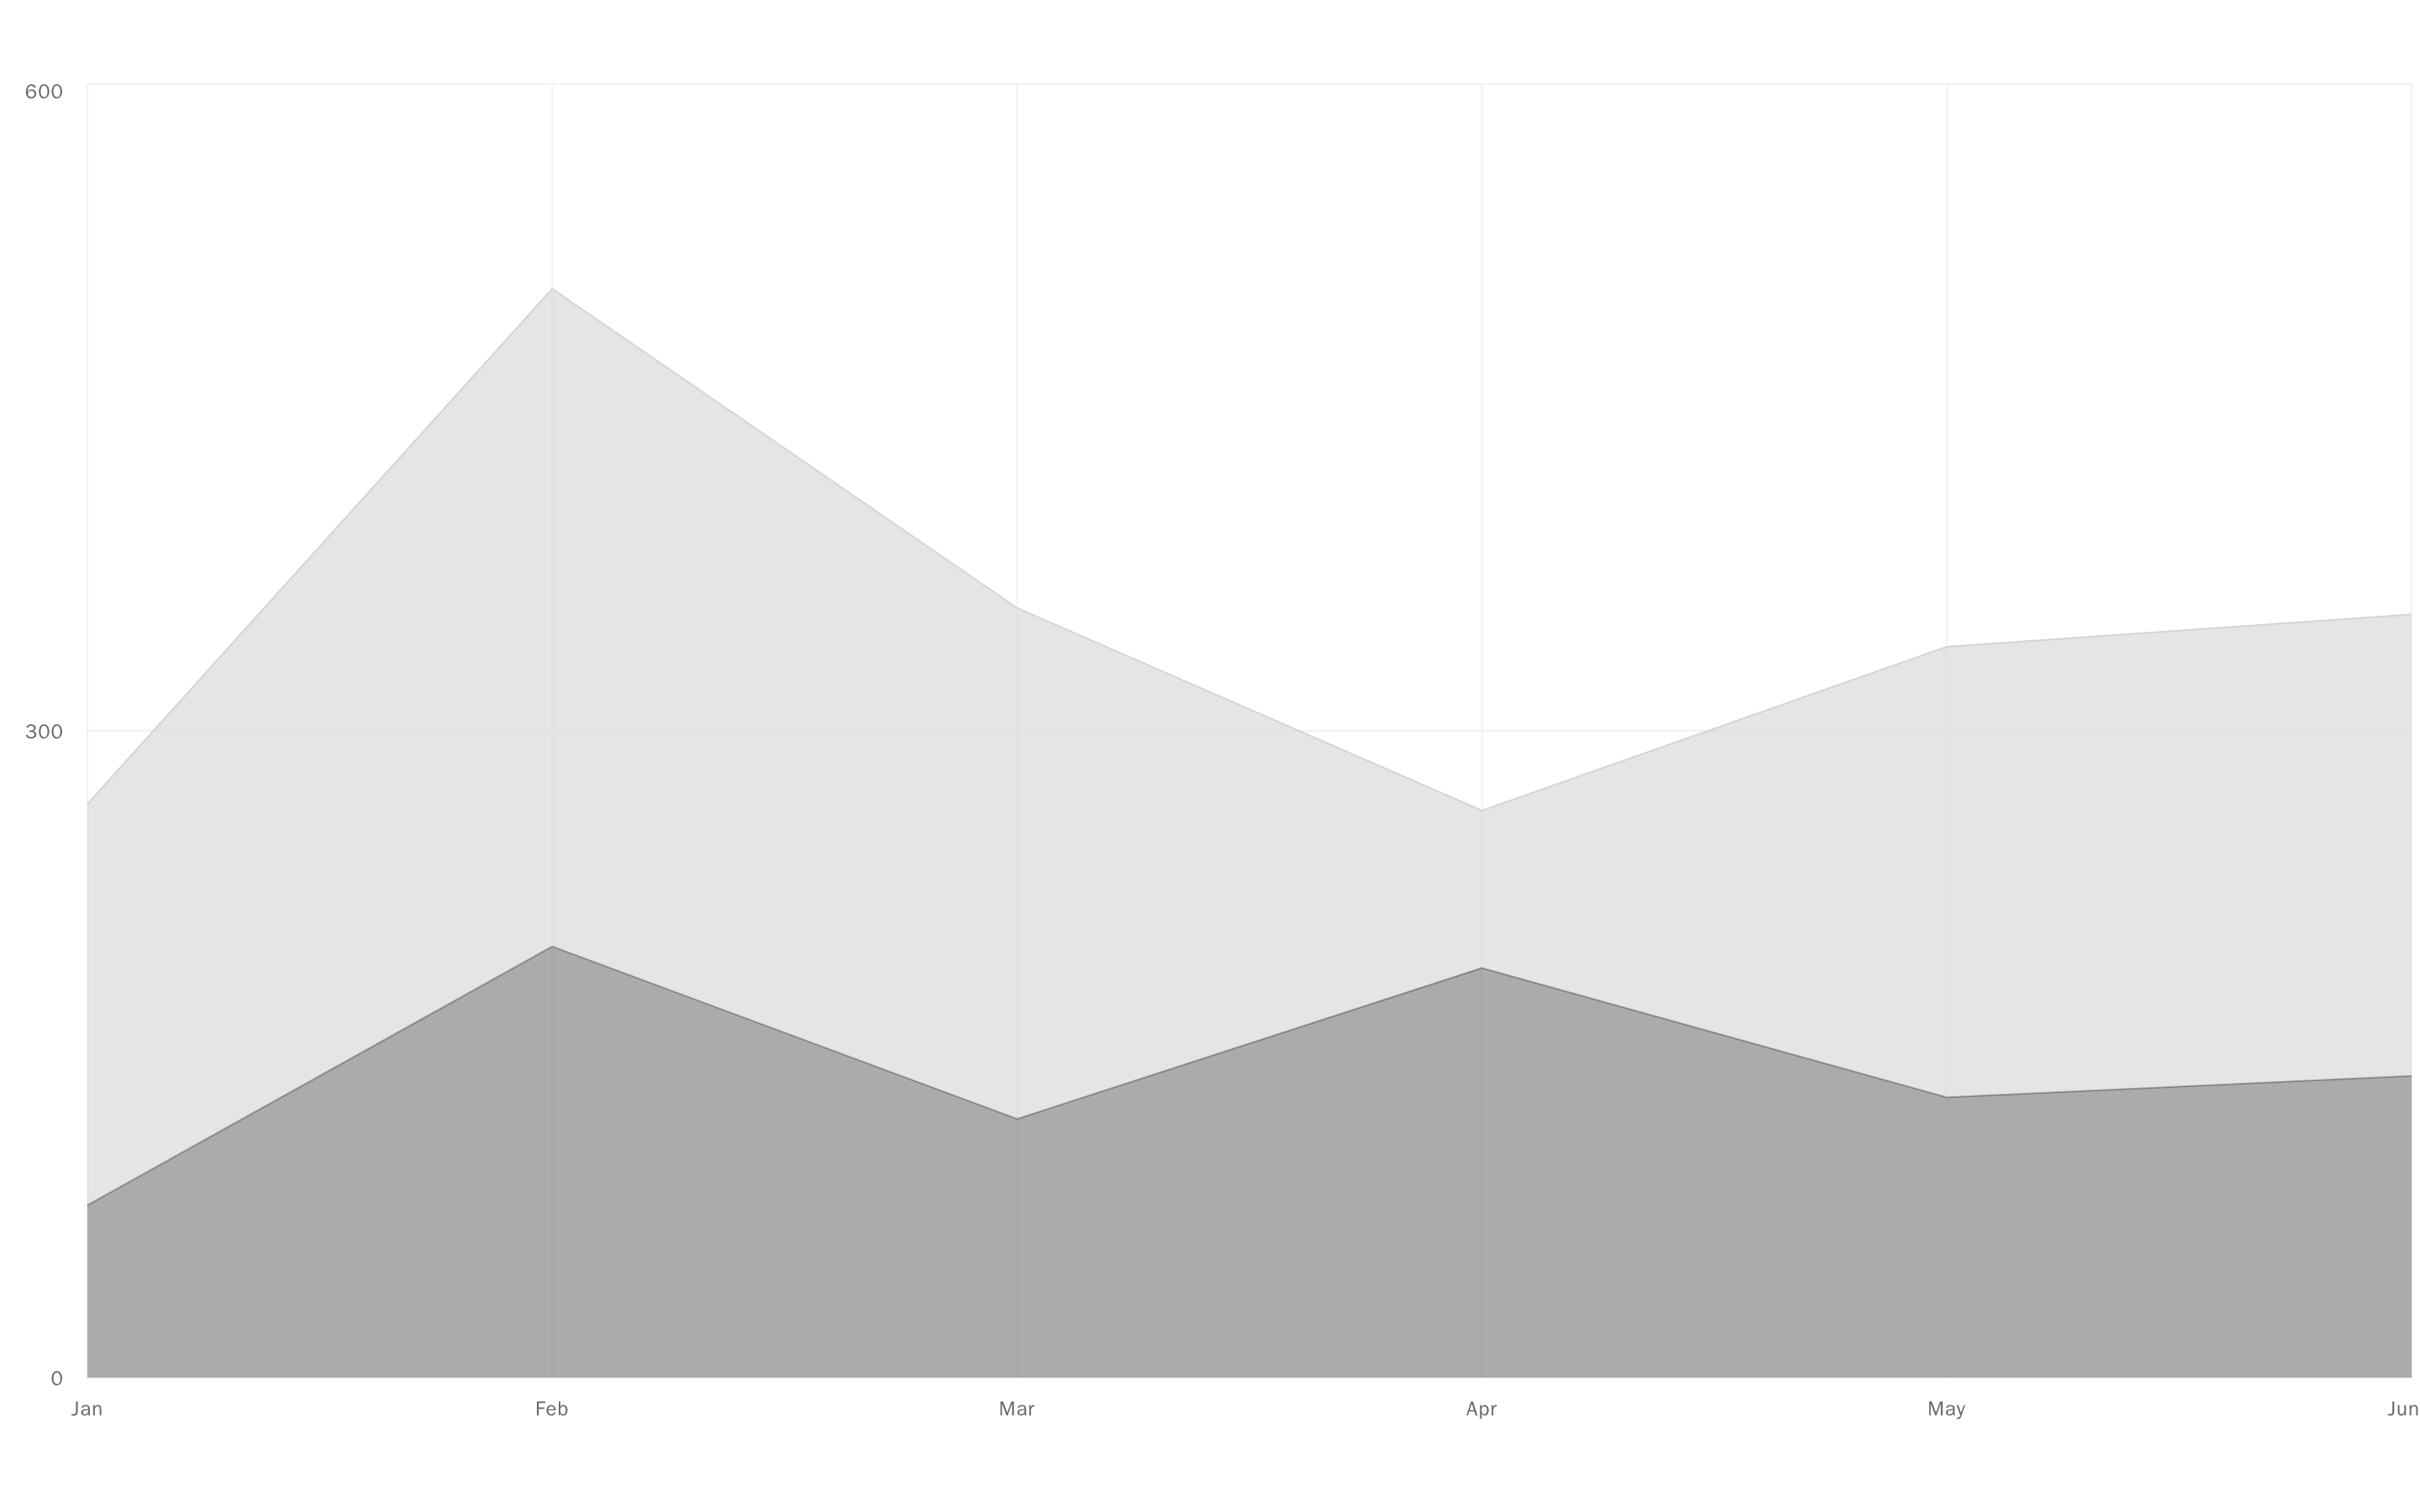
      <ChartArea
        title="Visitors"
        description={`New and returning, the last ${days} days`}
        data={current}
        xKey="date"
        categoryLabel="Day"
        categoryFormatter={(v) => day.format(new Date(`${String(v)}T00:00:00Z`))}
        locale={locale}
        stack="stacked"
        fillMode="gradient"
        aspect="panorama"
        series={[
          { key: "newVisitors", label: "New" },
          { key: "returning", label: "Returning", color: "var(--chart-3)" },
        ]}
      />

      <div className="grid grid-cols-1 gap-6 lg:grid-cols-2 [&>*]:min-w-0">
        <ChartBar
          title="Top pages"
          description="Views in the range"
          data={pages}
          xKey="page"
          categoryLabel="Page"
          layout="bars"
          labels
          valueAxis={false}
          grid="none"
          sort="descending"
          locale={locale}
          series={[{ key: "views", label: "Views" }]}
          aspect="wide"
        />
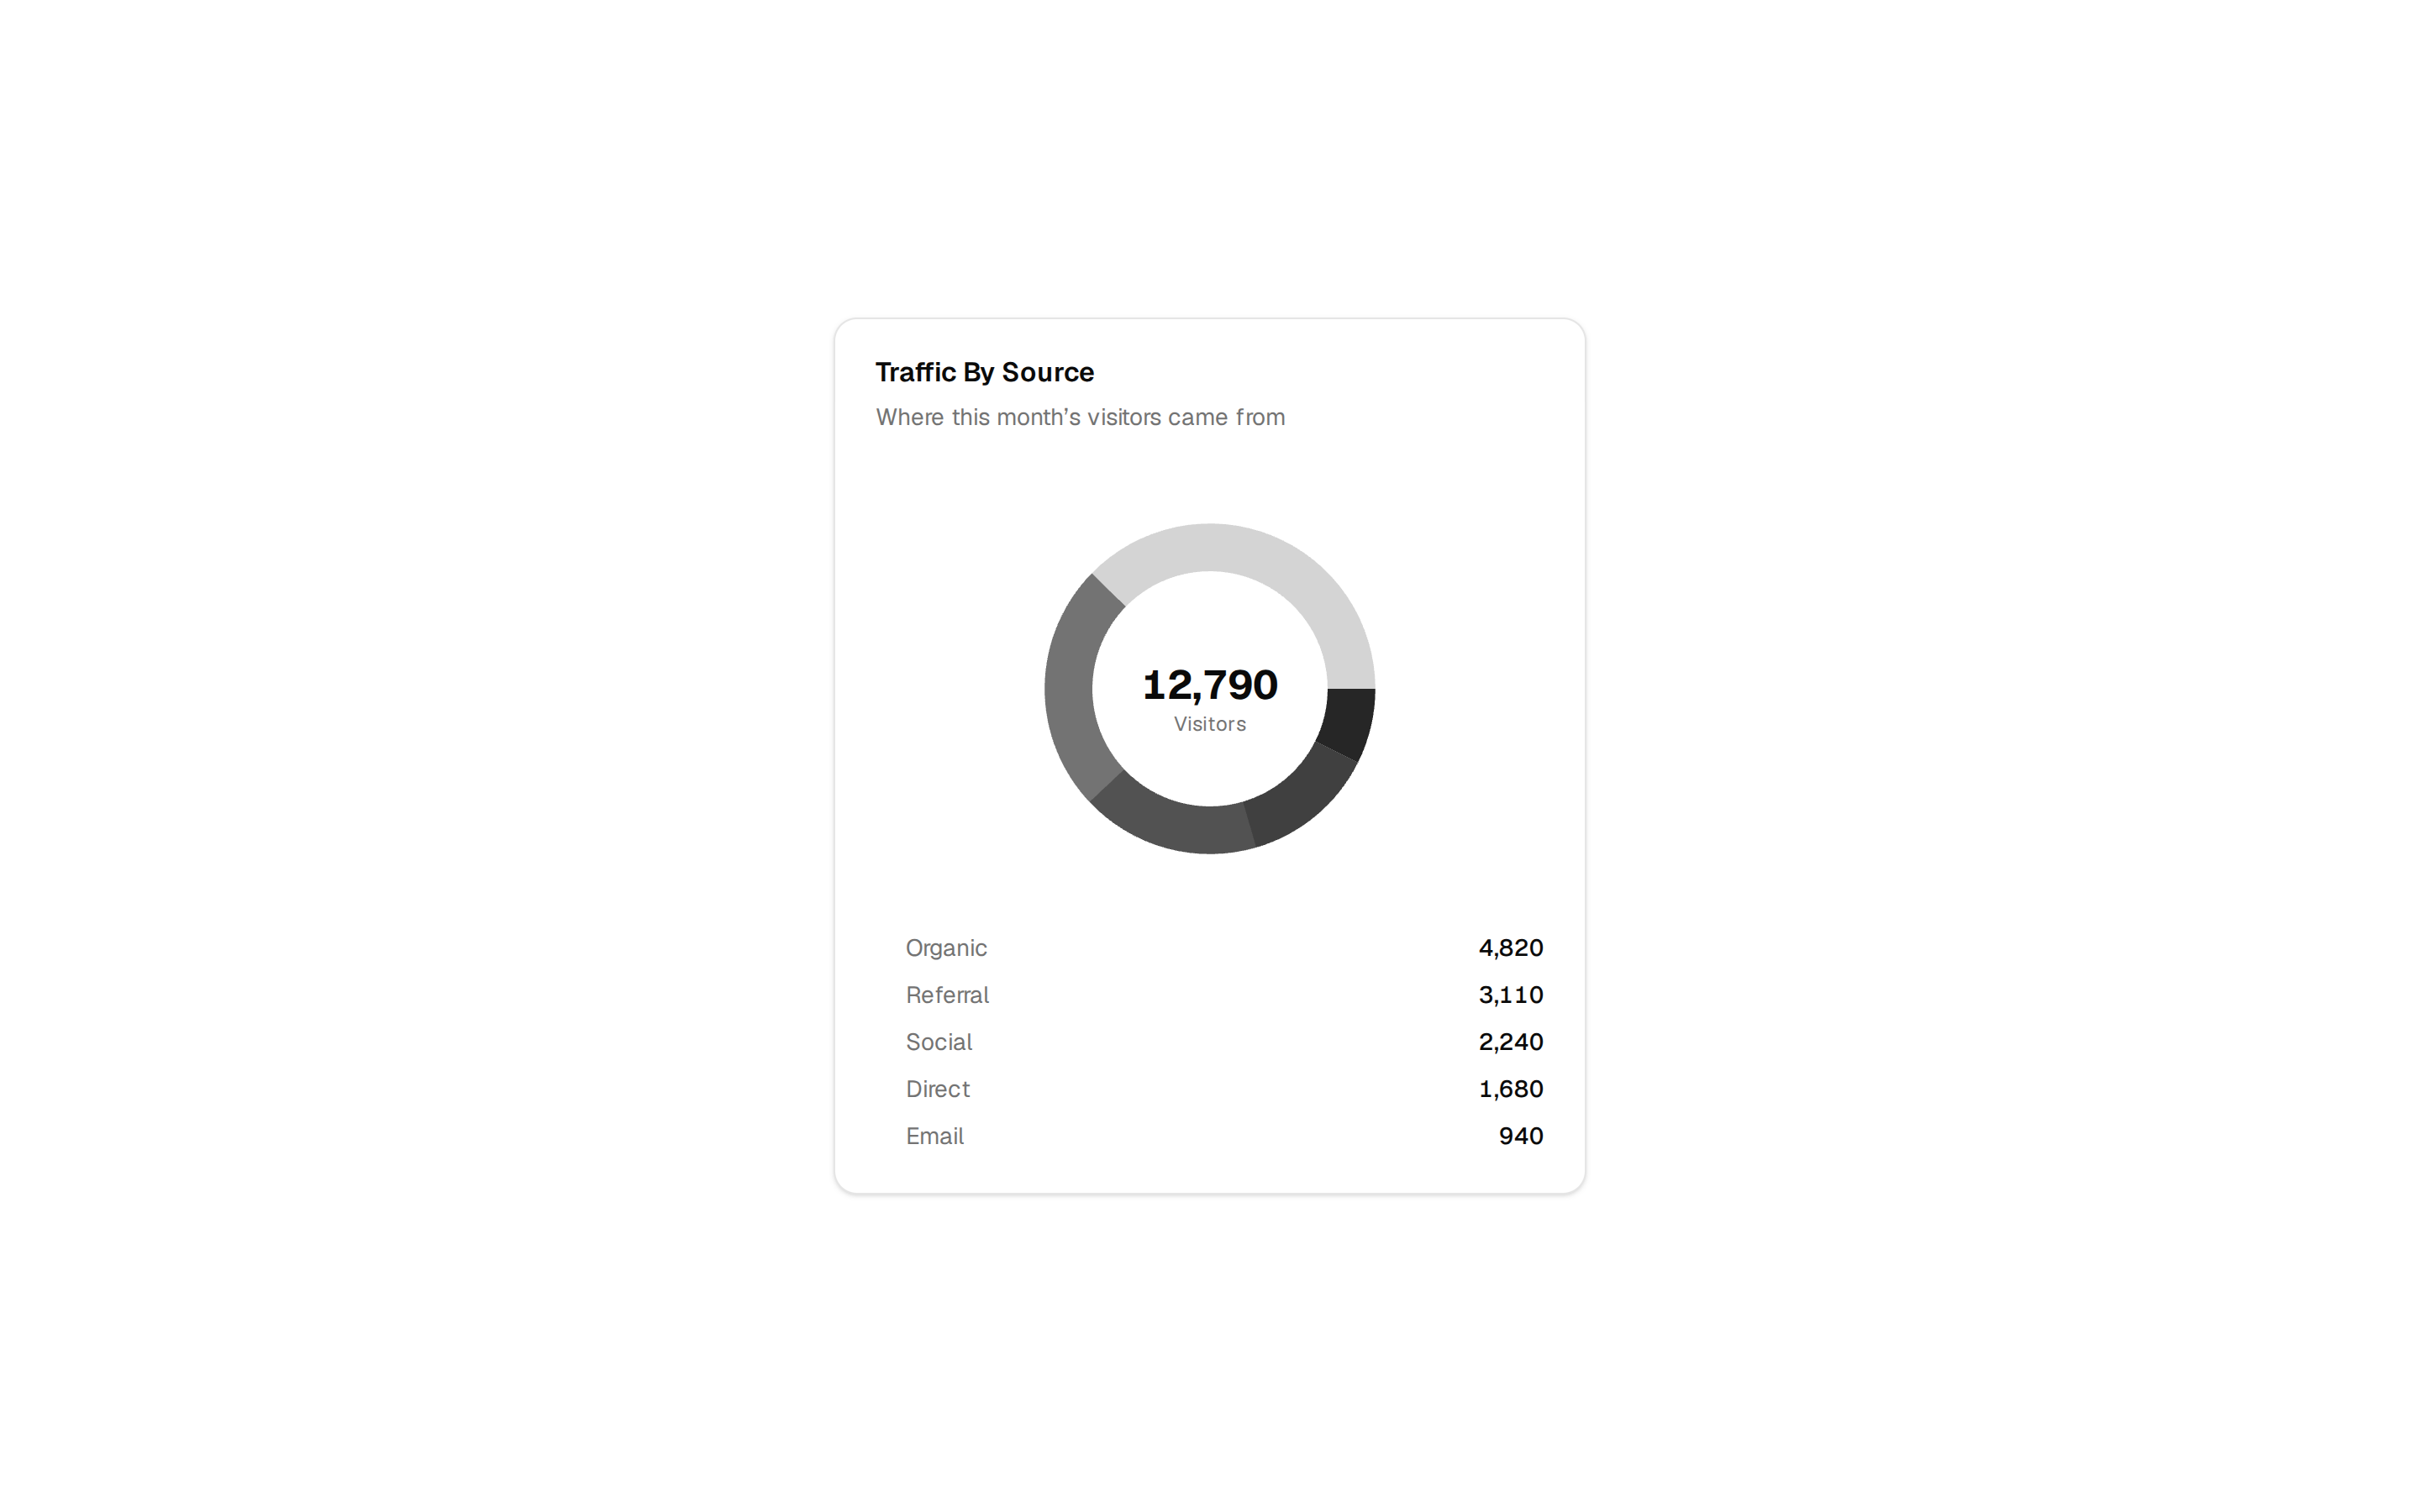
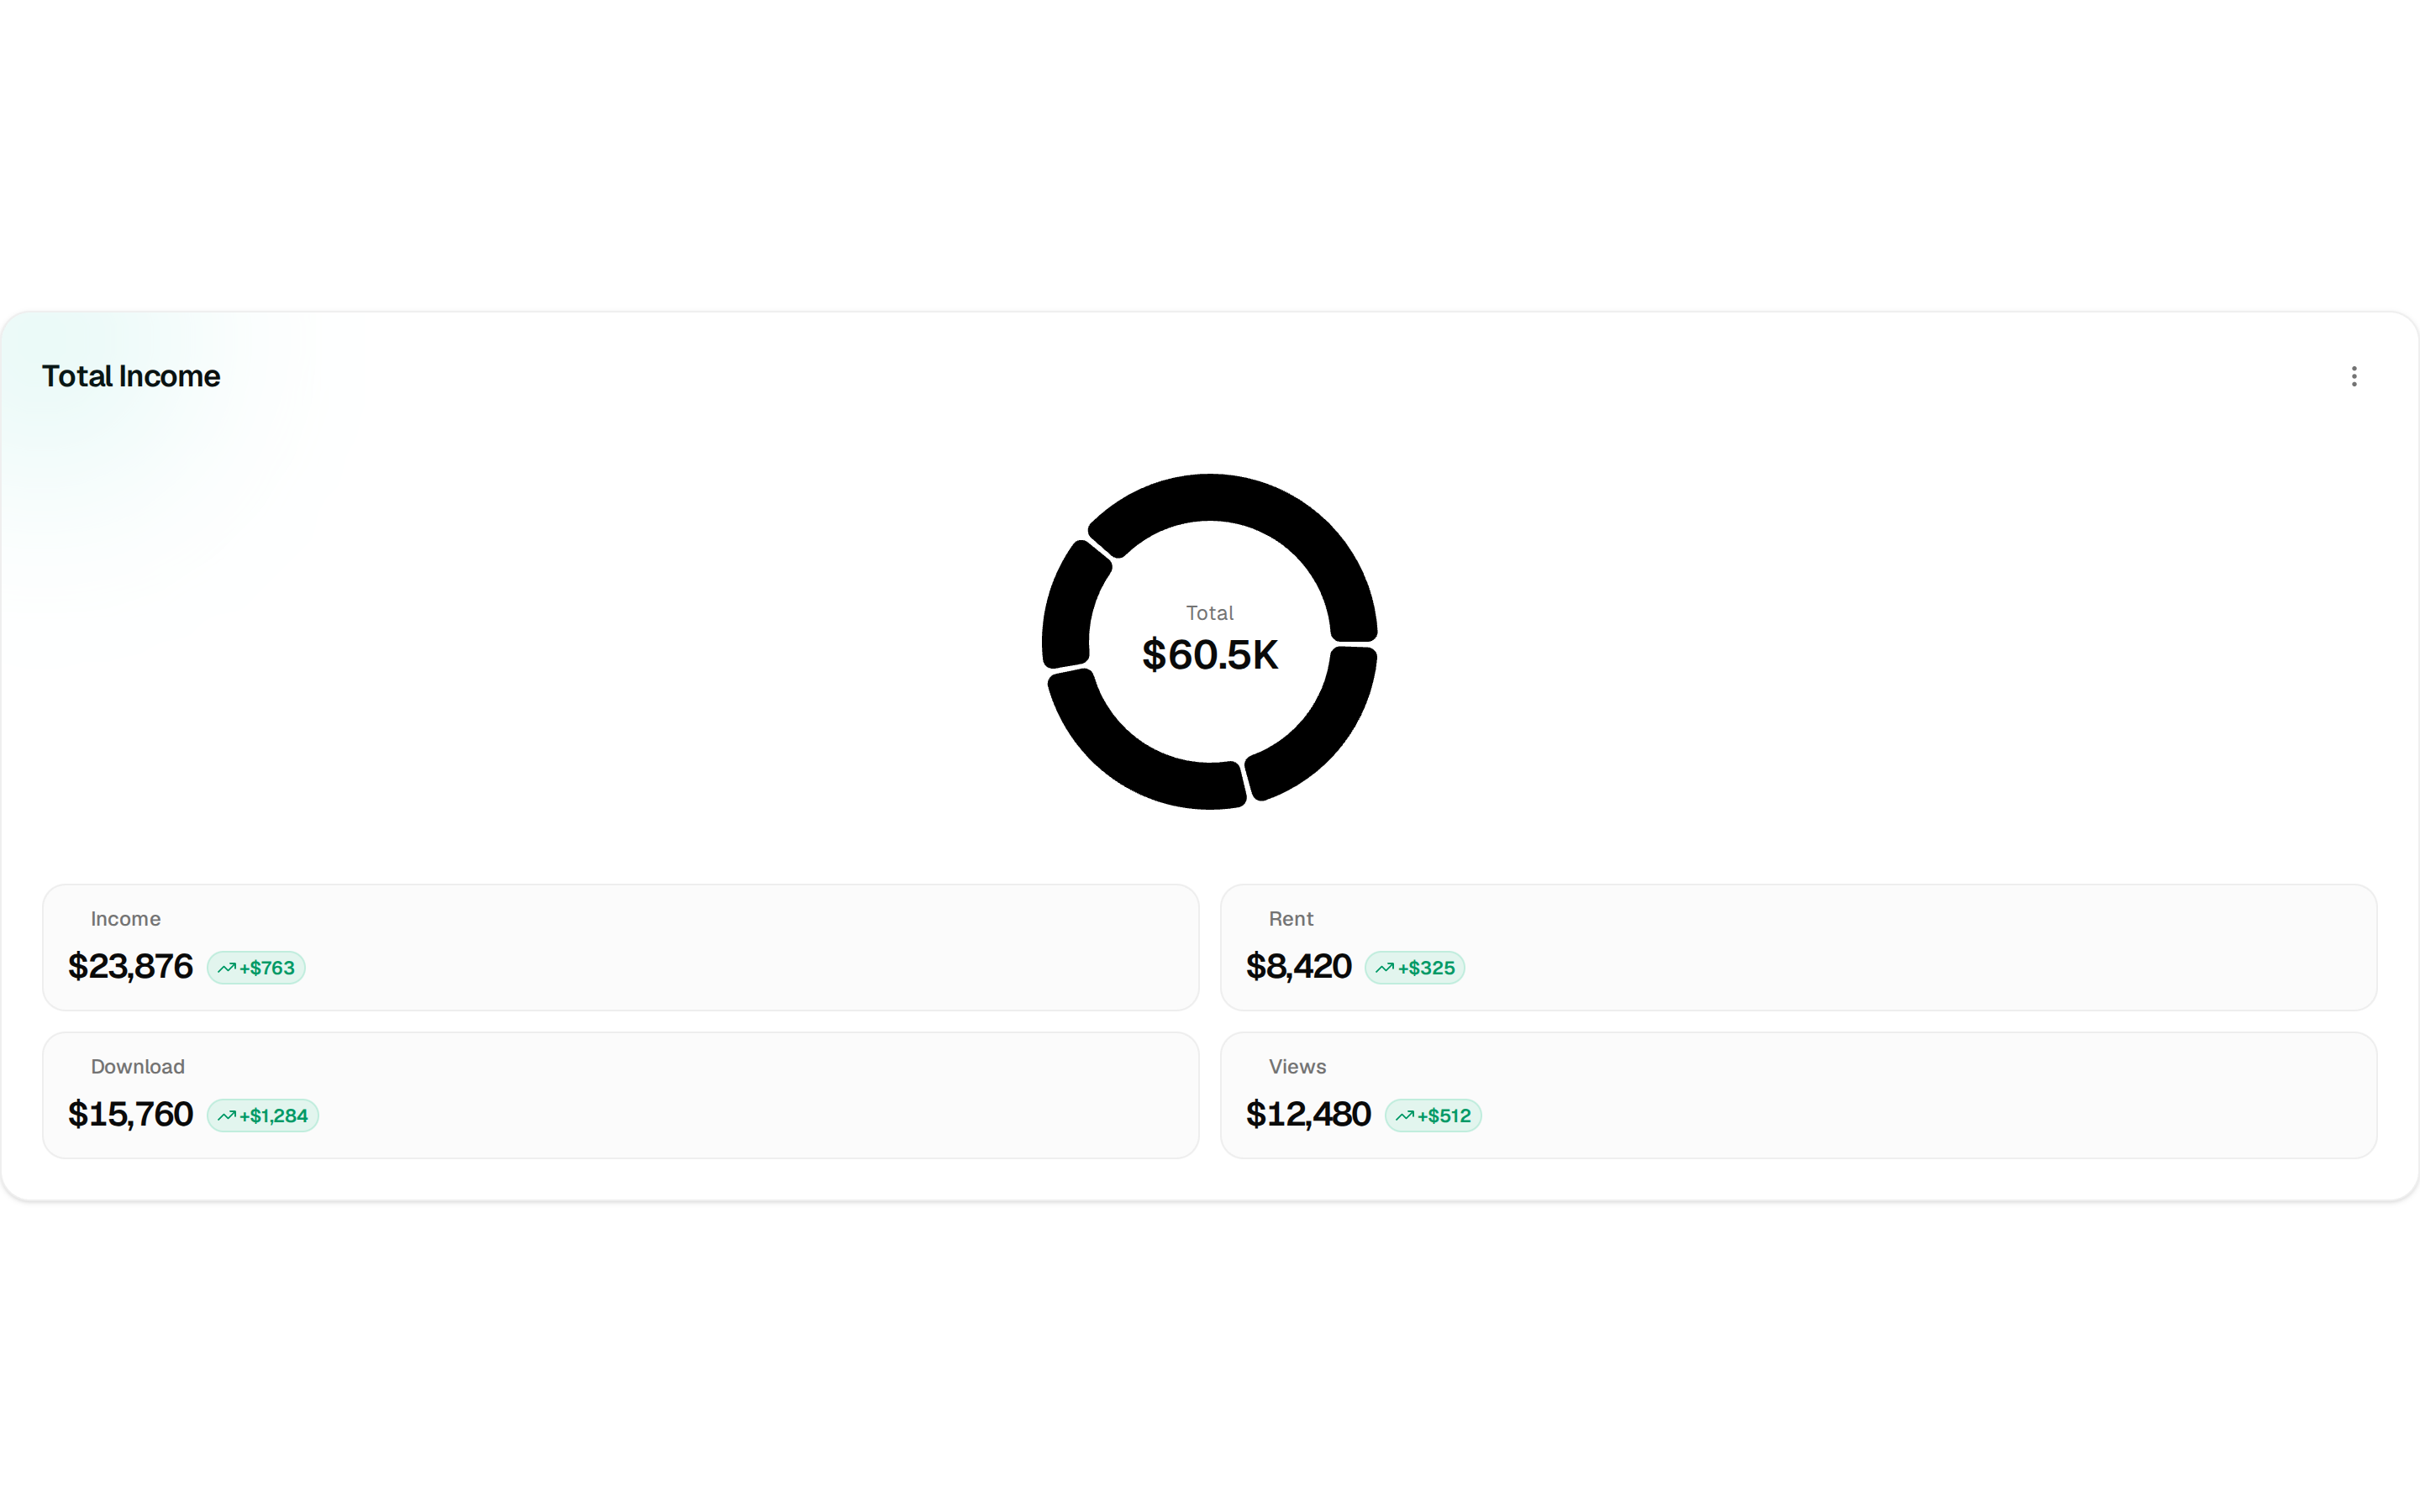
        <ChartPie title="Where visitors come from" description="Share of visits" data={sources} valueLabel="visits" categoryLabel="Source" locale={locale} aspect="video" />
      </div>
    </div>
  )

  return (
    <section data-slot="charts-1" data-state={state} aria-labelledby={`${id}-title`} className={cn("mx-auto w-full max-w-5xl px-4 py-10 sm:px-6", className)} {...frameProps(props)}>
      <header className="mb-8 flex flex-wrap items-end justify-between gap-4">
        <div>
          <h1 id={`${id}-title`} className="text-3xl font-semibold tracking-[-0.035em] text-balance">
            {title}
          </h1>
          <p className="text-muted-foreground mt-2 text-pretty">{description}</p>
        </div>
        {state === "ready" ? (
          <SegmentedControl
            aria-label="Range"
            value={range}
            onValueChange={(v) => {
              setRange(v as "7" | "30" | "90")
              onRangeChange?.(v as "7" | "30" | "90")
            }}
          >
            <SegmentedControlItem value="7">7 days</SegmentedControlItem>
            <SegmentedControlItem value="30">30 days</SegmentedControlItem>
            <SegmentedControlItem value="90">90 days</SegmentedControlItem>
          </SegmentedControl>
        ) : null}
      </header>
      <StateView
        state={state === "empty" || !current.length ? "empty" : state === "loading" || state === "error" ? state : "ready"}
        onRetry={onRetry}
        label="Loading analytics"
        loading={<Skel />}
        empty={{ icon: <ChartNoAxesColumn />, title: emptyState?.title ?? "No visits yet", description: emptyState?.description ?? "Once people visit, their numbers and charts appear here.", action: emptyState?.action }}
        error={{ title: errorState?.title ?? "Analytics could not be loaded", description: errorState?.description ?? "Check your connection and try again.", ...errorState }}
      >
        {content}
      </StateView>
    </section>
  )
}

export { Charts1, type Charts1Props, type Charts1Day, type Charts1Page, type Charts1Source }