Chart 02
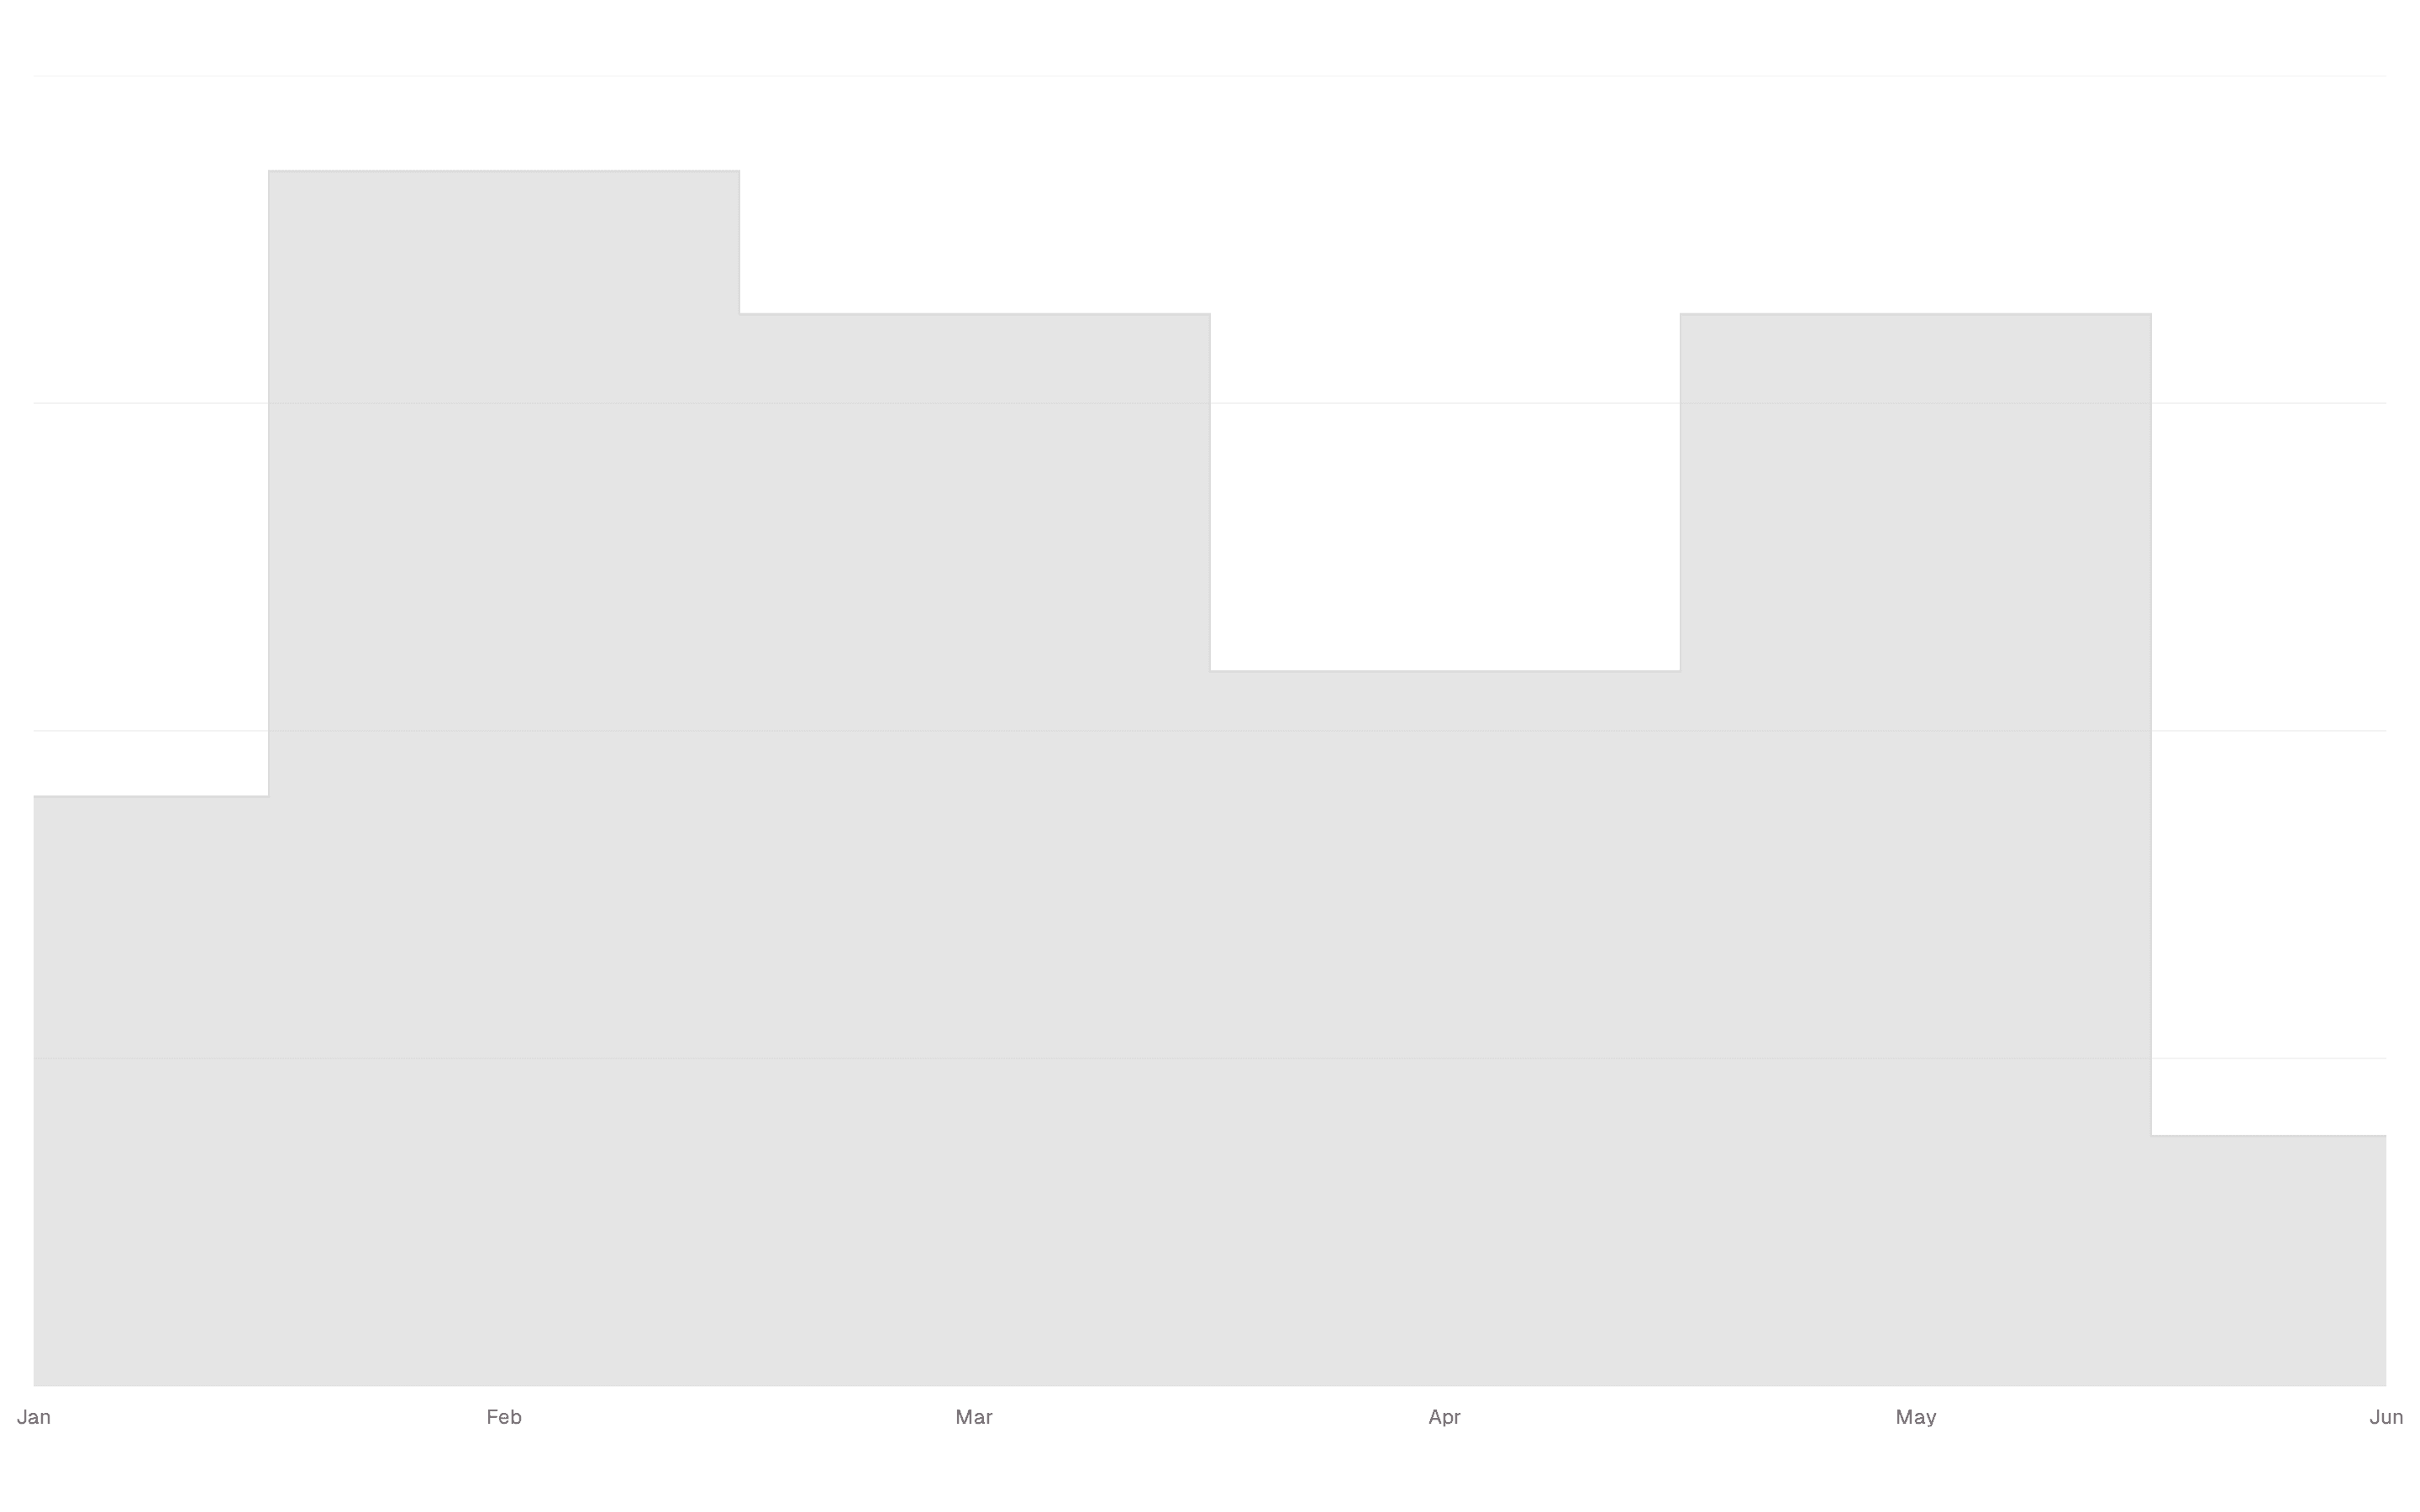
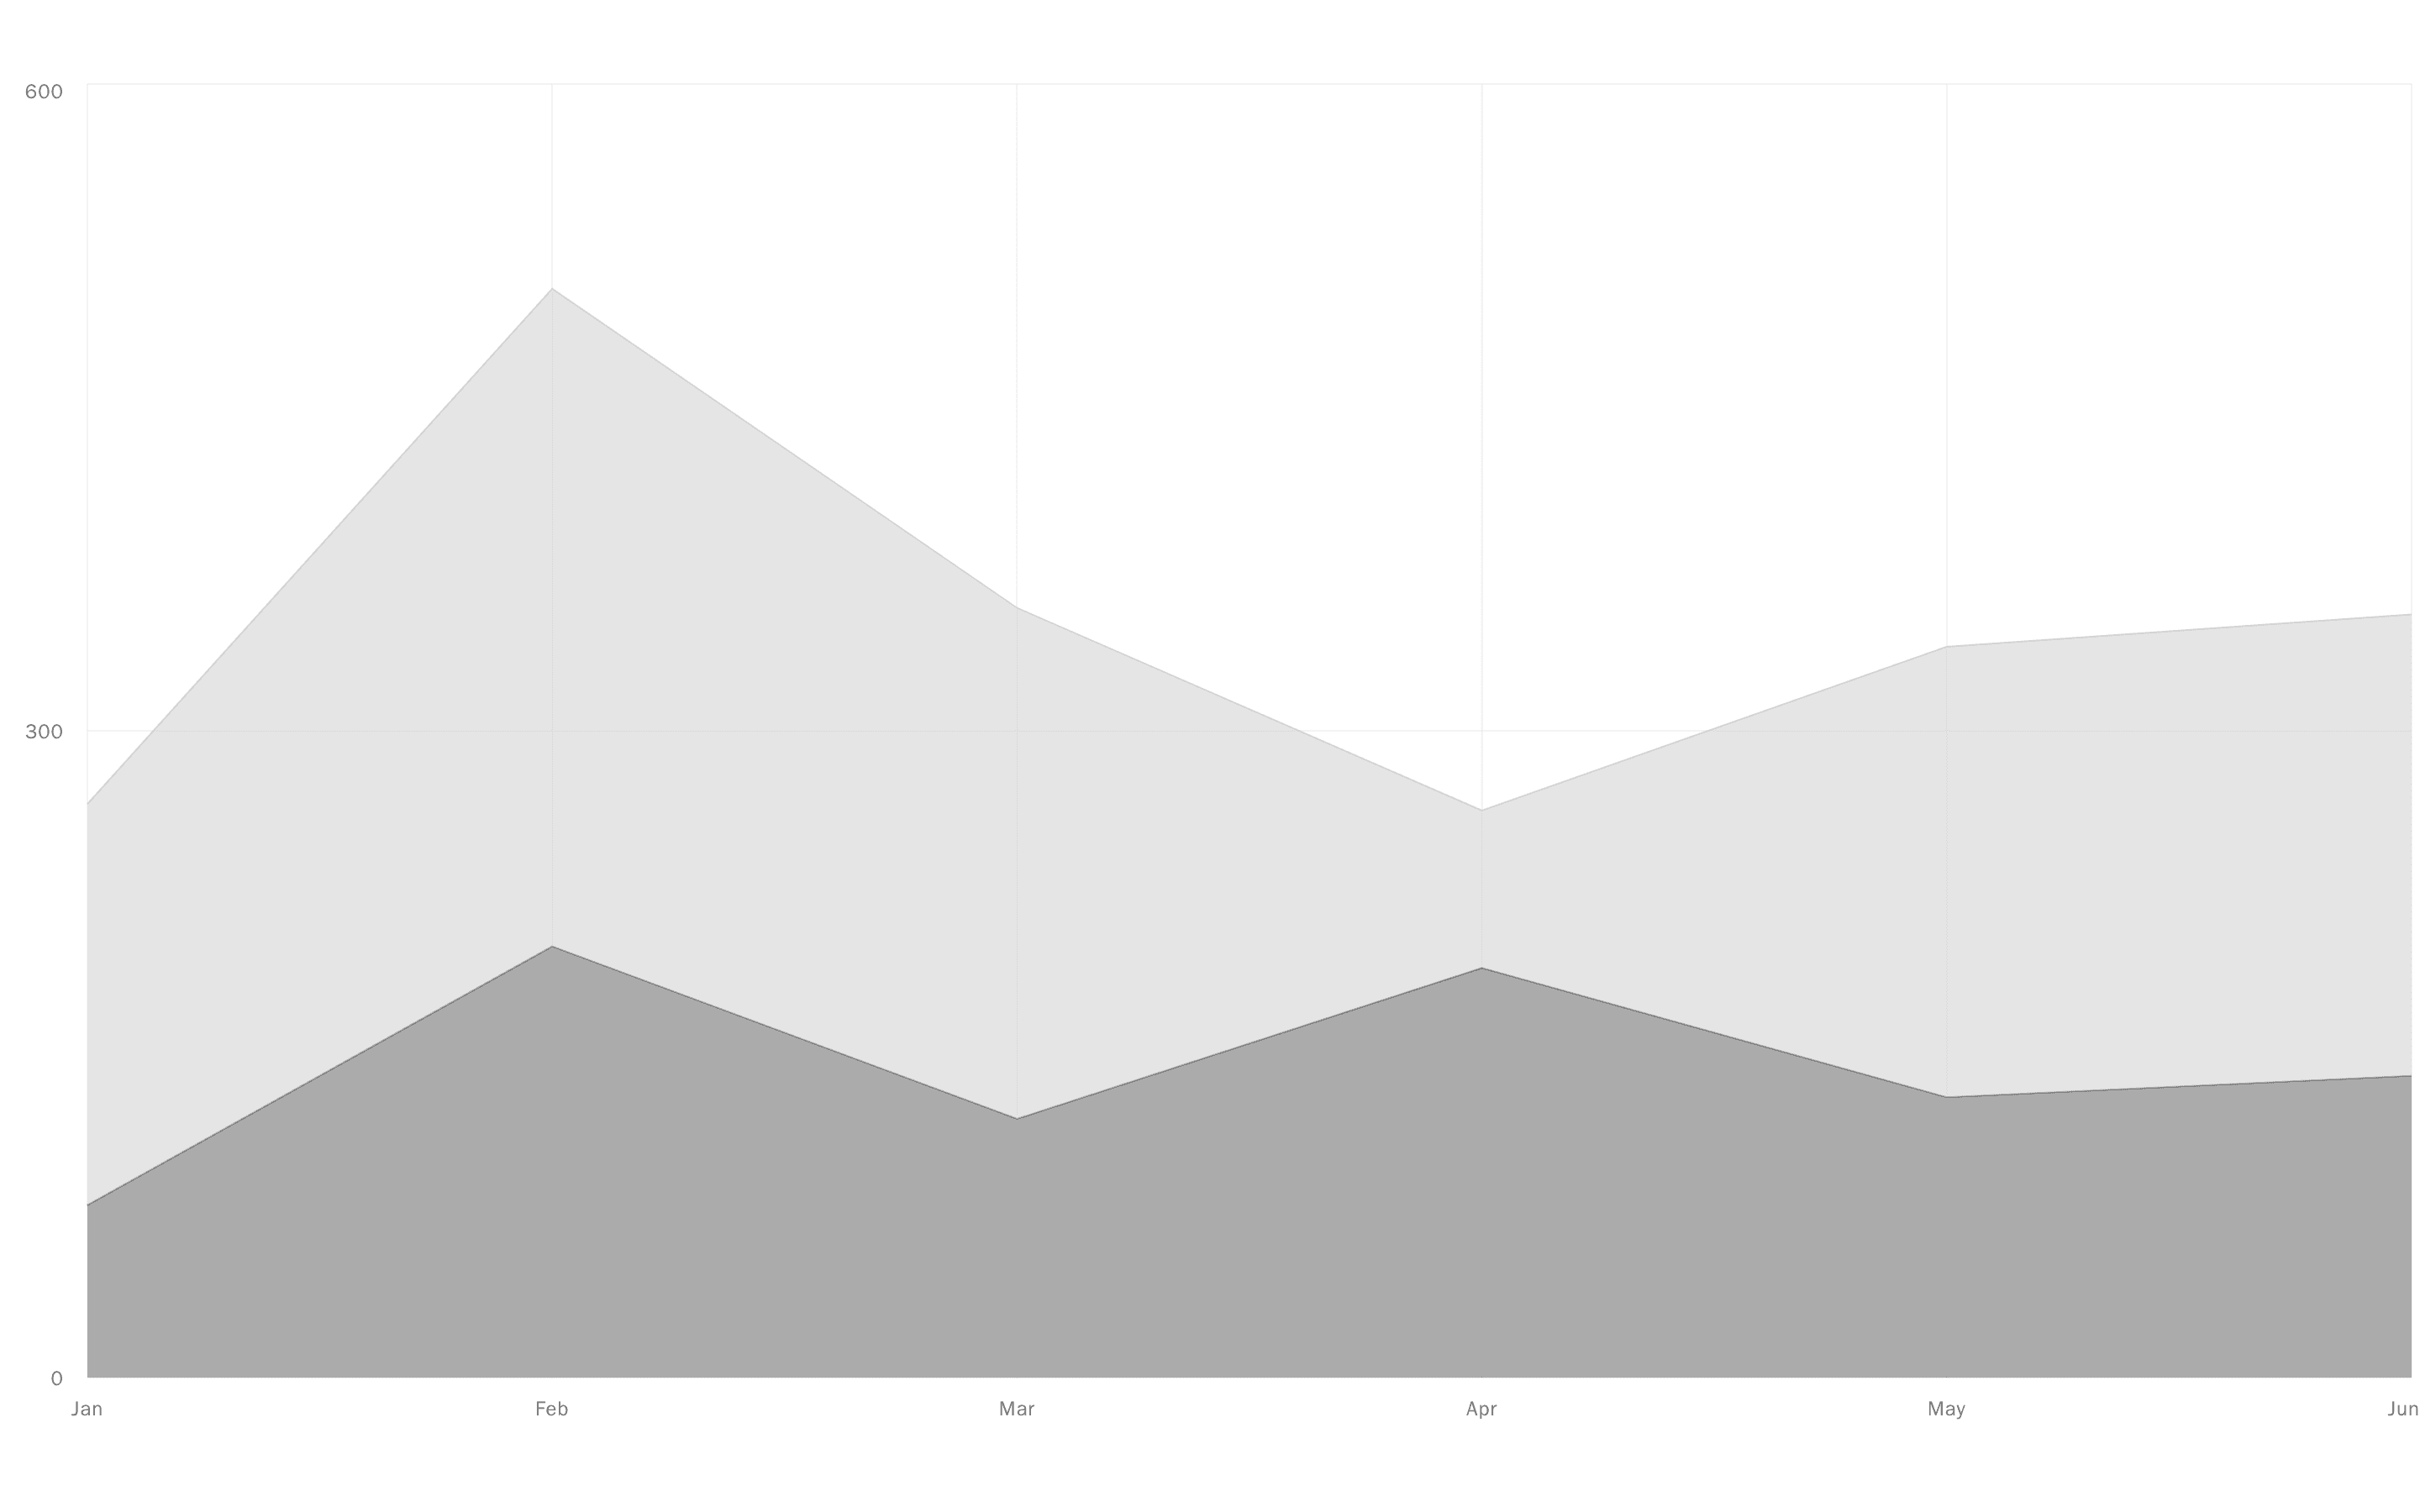
Traffic area charts for visitors and signups with a 7, 30 or 90 day range, legend cards that turn each series on or off, and a crosshair tooltip shared across both panels.
@hirael
Traffic area charts for visitors and signups with a 7, 30 or 90 day range, legend cards that turn each series on or off, and a crosshair tooltip shared across both panels.
@hirael
registry/hirael/bases/radix/blocks/chart-02/chart-02.tsx
// Chart 02 from Hirael <https://hirael.com/blocks/charts/chart-02>
// MIT · Mohammad Shehadeh · https://github.com/MohammadShehadeh/hirael

'use client';

import * as React from 'react';
import { ArrowDown, ArrowUp } from 'lucide-react';
import { Area, AreaChart, CartesianGrid, XAxis, YAxis } from 'recharts';

import { cn } from '@/lib/utils';
import { Card, CardContent, CardDescription, CardHeader, CardTitle } from '@/registry/hirael/bases/radix/ui/card';
import { ChartContainer, ChartTooltip, type ChartConfig } from '@/registry/hirael/bases/radix/ui/chart';
import { useDirection } from '@/registry/hirael/bases/radix/ui/direction';
import { ToggleGroup, ToggleGroupItem } from '@/registry/hirael/bases/radix/ui/toggle-group';

const EASE = 'ease-[cubic-bezier(0.22,1,0.36,1)]';
const ENTER = `animate-in fade-in slide-in-from-bottom-4 duration-500 ${EASE} fill-mode-both motion-reduce:animate-none`;
const SWAP = `animate-in fade-in slide-in-from-bottom-1 duration-300 ${EASE} fill-mode-both motion-reduce:animate-none`;

const stagger = (index: number, step = 80): React.CSSProperties => ({ animationDelay: `${index * step}ms` });

// Axis text is Latin; an inherited RTL direction would flip its text-anchor into the plot.
const PLOT_TEXT = 'tabular-nums [&_svg_text]:[direction:ltr]';

type Series = 'visitors' | 'signups';
type Range = '7' | '30' | '90';

const SERIES: readonly Series[] = ['visitors', 'signups'];
const RANGES: readonly Range[] = ['7', '30', '90'];

const chartConfig = {
  visitors: { label: 'Visitors', color: 'var(--chart-1)' },
  signups: { label: 'Signups', color: 'var(--chart-2)' },
} satisfies ChartConfig;

interface DayRow {
  date: string;
  visitors: number;
  signups: number;
}

const DAY_MS = 86_400_000;
const LAST_DAY = Date.UTC(2026, 8, 23);
const HISTORY_DAYS = 180;

// A fixed seed keeps the server and client render identical.
const seeded = (seed: number) => {
  let state = seed;

  return () => {
    state = (state * 16807) % 2147483647;

    return state / 2147483647;
  };
};

const DAYS: readonly DayRow[] = (() => {
  const random = seeded(20260923);

  return Array.from({ length: HISTORY_DAYS }, (_, i) => {
    const time = LAST_DAY - (HISTORY_DAYS - 1 - i) * DAY_MS;
    const weekday = new Date(time).getUTCDay();
    const weekend = weekday === 0 || weekday === 6;
    const visitors = Math.round((2600 + i * 9) * (weekend ? 0.72 : 1) * (0.9 + random() * 0.2));
    const signups = Math.round(visitors * (0.027 + i * 0.00005 + random() * 0.004));

    return { date: new Date(time).toISOString().slice(0, 10), visitors, signups };
  });
})();

const count = new Intl.NumberFormat('en-US');
const compact = new Intl.NumberFormat('en-US', { notation: 'compact', maximumFractionDigits: 1 });
const shortDate = new Intl.DateTimeFormat('en-US', { month: 'short', day: 'numeric', timeZone: 'UTC' });
const longDate = new Intl.DateTimeFormat('en-US', {
  weekday: 'short',
  month: 'short',
  day: 'numeric',
  timeZone: 'UTC',
});

const formatDate = (iso: string, format: Intl.DateTimeFormat) => format.format(new Date(`${iso}T00:00:00Z`));

const total = (rows: readonly DayRow[], key: Series) => rows.reduce((acc, row) => acc + row[key], 0);

const percentChange = (current: number, previous: number) => Math.round((current / previous - 1) * 100);

const conversion = (rows: readonly DayRow[]) => (total(rows, 'signups') / total(rows, 'visitors')) * 100;

const sliceRange = (range: Range) => {
  const days = Number(range);

  return { current: DAYS.slice(-days), previous: DAYS.slice(-days * 2, -days) };
};

const summarize = (range: Range, visible: readonly Series[]) => {
  const { current, previous } = sliceRange(range);
  const changes = visible.map((key, i) => {
    const change = percentChange(total(current, key), total(previous, key));
    const name = i === 0 ? chartConfig[key].label : chartConfig[key].label.toLowerCase();
    const trend = change >= 0 ? `up ${change}%` : `down ${Math.abs(change)}%`;

    return `${name} are ${trend}`;
  });
  const sentence = `${changes.join(' and ')} on the previous ${range} days.`;

  if (visible.length < SERIES.length) return sentence;

  const rate = conversion(current).toFixed(1);
  const previousRate = conversion(previous).toFixed(1);
  const direction = Number(rate) >= Number(previousRate) ? 'up from' : 'down from';

  return `${sentence} ${rate}% of visitors signed up, ${direction} ${previousRate}%.`;
};

interface TooltipBodyProps {
  active?: boolean;
  payload?: readonly { payload?: DayRow }[];
  visible: readonly Series[];
}

const TooltipBody = ({ active, payload, visible }: TooltipBodyProps) => {
  const row = payload?.[0]?.payload;
  if (!active || !row) return null;

  return (
    <div
      data-slot="traffic-chart-tooltip"
      className="grid min-w-40 gap-1.5 rounded-lg border border-border bg-popover px-3 py-2 text-xs text-popover-foreground shadow-md"
    >
      <p className="font-medium">{formatDate(row.date, longDate)}</p>
      {visible.map((key) => (
        <div key={key} className="flex items-center gap-2">
          <span
            aria-hidden
            className="h-0.5 w-3 shrink-0 rounded-full"
            style={{ backgroundColor: `var(--color-${key})` }}
          />
          <span className="flex-1 text-muted-foreground">{chartConfig[key].label}</span>
          <span className="font-medium tabular-nums">{count.format(row[key])}</span>
        </div>
      ))}
      {visible.length === SERIES.length ? (
        <div className="flex items-center gap-2 border-t border-border pt-1.5">
          <span className="flex-1 text-muted-foreground">Signup rate</span>
          <span className="font-medium tabular-nums">{((row.signups / row.visitors) * 100).toFixed(1)}%</span>
        </div>
      ) : null}
    </div>
  );
};

interface LegendToggleProps {
  series: Series;
  value: number;
  change: number;
  pressed: boolean;
  locked: boolean;
  onToggle: () => void;
}

const LegendToggle = ({ series, value, change, pressed, locked, onToggle }: LegendToggleProps) => {
  const Arrow = change >= 0 ? ArrowUp : ArrowDown;

  return (
    <button
      type="button"
      data-slot="traffic-chart-legend-item"
      aria-pressed={pressed}
      disabled={locked}
      title={locked ? 'At least one series stays on' : undefined}
      onClick={onToggle}
      className={cn(
        'flex min-w-0 flex-col items-start gap-1 rounded-lg border border-border px-3 py-2 text-start transition-[opacity,background-color] duration-150 ease-out outline-none hover:bg-muted/50 focus-visible:ring-[3px] focus-visible:ring-ring/50 disabled:cursor-not-allowed sm:min-w-36',
        !pressed && 'opacity-50',
      )}
    >
      <span className="flex items-center gap-1.5 text-xs text-muted-foreground">
        <span
          aria-hidden
          className={cn('size-2.5 rounded-[3px] border-2', !pressed && 'bg-transparent')}
          style={{
            borderColor: chartConfig[series].color,
            backgroundColor: pressed ? chartConfig[series].color : undefined,
          }}
        />
        {chartConfig[series].label}
      </span>
      <span className="flex flex-wrap items-baseline gap-x-2">
        <span className="text-xl font-semibold tracking-tight tabular-nums">{count.format(value)}</span>
        <span className="inline-flex items-center gap-0.5 text-xs text-muted-foreground tabular-nums">
          <Arrow aria-hidden className="size-3" />
          {Math.abs(change)}%<span className="sr-only">{change >= 0 ? ' up' : ' down'}</span>
        </span>
      </span>
    </button>
  );
};

const Chart02 = () => {
  const [range, setRange] = React.useState<Range>('30');
  const [hidden, setHidden] = React.useState<Series[]>([]);
  const isRtl = useDirection() === 'rtl';

  const visible = SERIES.filter((key) => !hidden.includes(key));
  const { current, previous } = React.useMemo(() => sliceRange(range), [range]);
  const summary = summarize(range, visible);

  const toggle = (key: Series) =>
    setHidden((keys) => (keys.includes(key) ? keys.filter((k) => k !== key) : [...keys, key]));

  return (
    <section
      data-slot="traffic-chart"
      aria-labelledby="chart-02-heading"
      className="bg-background px-4 py-16 sm:px-6 sm:py-24"
    >
      <Card data-slot="traffic-chart-card" className={cn(ENTER, 'mx-auto w-full max-w-3xl')}>
        <CardHeader>
          <CardTitle>
            <h2 id="chart-02-heading" className="text-balance">
              Traffic
            </h2>
          </CardTitle>
          <CardDescription data-slot="traffic-chart-summary" aria-live="polite" className="max-w-xl">
            <span key={`${range}-${visible.join()}`} className={cn(SWAP, 'block text-pretty')}>
              {summary}
            </span>
          </CardDescription>
        </CardHeader>

        <CardContent style={stagger(1)} className={ENTER}>
          <div className="flex flex-col gap-6">
            <ToggleGroup
              type="single"
              variant="outline"
              value={range}
              onValueChange={(next) => {
                if (next) setRange(next as Range);
              }}
              aria-label="Date range"
              data-slot="traffic-chart-range"
            >
              {RANGES.map((option) => (
                <ToggleGroupItem key={option} value={option} aria-label={`Last ${option} days`}>
                  {option}d
                </ToggleGroupItem>
              ))}
            </ToggleGroup>

            <div
              data-slot="traffic-chart-legend"
              role="group"
              aria-label="Series"
              className="grid grid-cols-2 gap-2 sm:flex sm:flex-wrap"
            >
              {SERIES.map((key) => {
                const pressed = visible.includes(key);

                return (
                  <LegendToggle
                    key={key}
                    series={key}
                    value={total(current, key)}
                    change={percentChange(total(current, key), total(previous, key))}
                    pressed={pressed}
                    locked={pressed && visible.length === 1}
                    onToggle={() => toggle(key)}
                  />
                );
              })}
            </div>

            <div data-slot="traffic-chart-plot" className={cn(PLOT_TEXT, 'flex flex-col gap-4')}>
              {visible.map((key, i) => {
                const last = i === visible.length - 1;

                return (
                  <div key={key} className={cn(SWAP, 'flex flex-col gap-1')}>
                    <span className="text-xs text-muted-foreground uppercase">{chartConfig[key].label} per day</span>
                    <ChartContainer
                      config={chartConfig}
                      className={cn('w-full', visible.length === 1 ? 'h-81' : last ? 'h-40' : 'h-32')}
                    >
                      <AreaChart
                        data={current}
                        syncId="traffic-chart"
                        margin={{ top: 6, right: 4, bottom: last ? 0 : 6, left: 4 }}
                      >
                        <CartesianGrid vertical={false} />
                        <XAxis
                          dataKey="date"
                          hide={!last}
                          reversed={isRtl}
                          tickLine={false}
                          axisLine={false}
                          tickMargin={8}
                          minTickGap={28}
                          tickFormatter={(value: string) => formatDate(value, shortDate)}
                        />
                        <YAxis
                          orientation={isRtl ? 'right' : 'left'}
                          tickLine={false}
                          axisLine={false}
                          tickMargin={6}
                          width={40}
                          tickCount={4}
                          interval={0}
                          tickFormatter={(value: number) => compact.format(value)}
                        />
                        <ChartTooltip
                          cursor={{ stroke: 'var(--muted-foreground)', strokeWidth: 1 }}
                          content={({ active, payload }) =>
                            i === 0 ? (
                              <TooltipBody
                                active={active}
                                payload={payload as TooltipBodyProps['payload']}
                                visible={visible}
                              />
                            ) : null
                          }
                        />
                        <Area
                          dataKey={key}
                          type="monotone"
                          stroke={`var(--color-${key})`}
                          strokeWidth={2}
                          fill={`var(--color-${key})`}
                          fillOpacity={0.1}
                          dot={false}
                          activeDot={{ r: 4, fill: `var(--color-${key})`, stroke: 'var(--card)', strokeWidth: 2 }}
                        />
                      </AreaChart>
                    </ChartContainer>
                  </div>
                );
              })}
            </div>
          </div>
        </CardContent>
      </Card>
    </section>
  );
};

export default Chart02;
Charts run on recharts via the shadcn chart primitive. Give ChartContainer's parent an explicit height, and update chartConfig's keys when you swap in real data.