Line Chart Dots
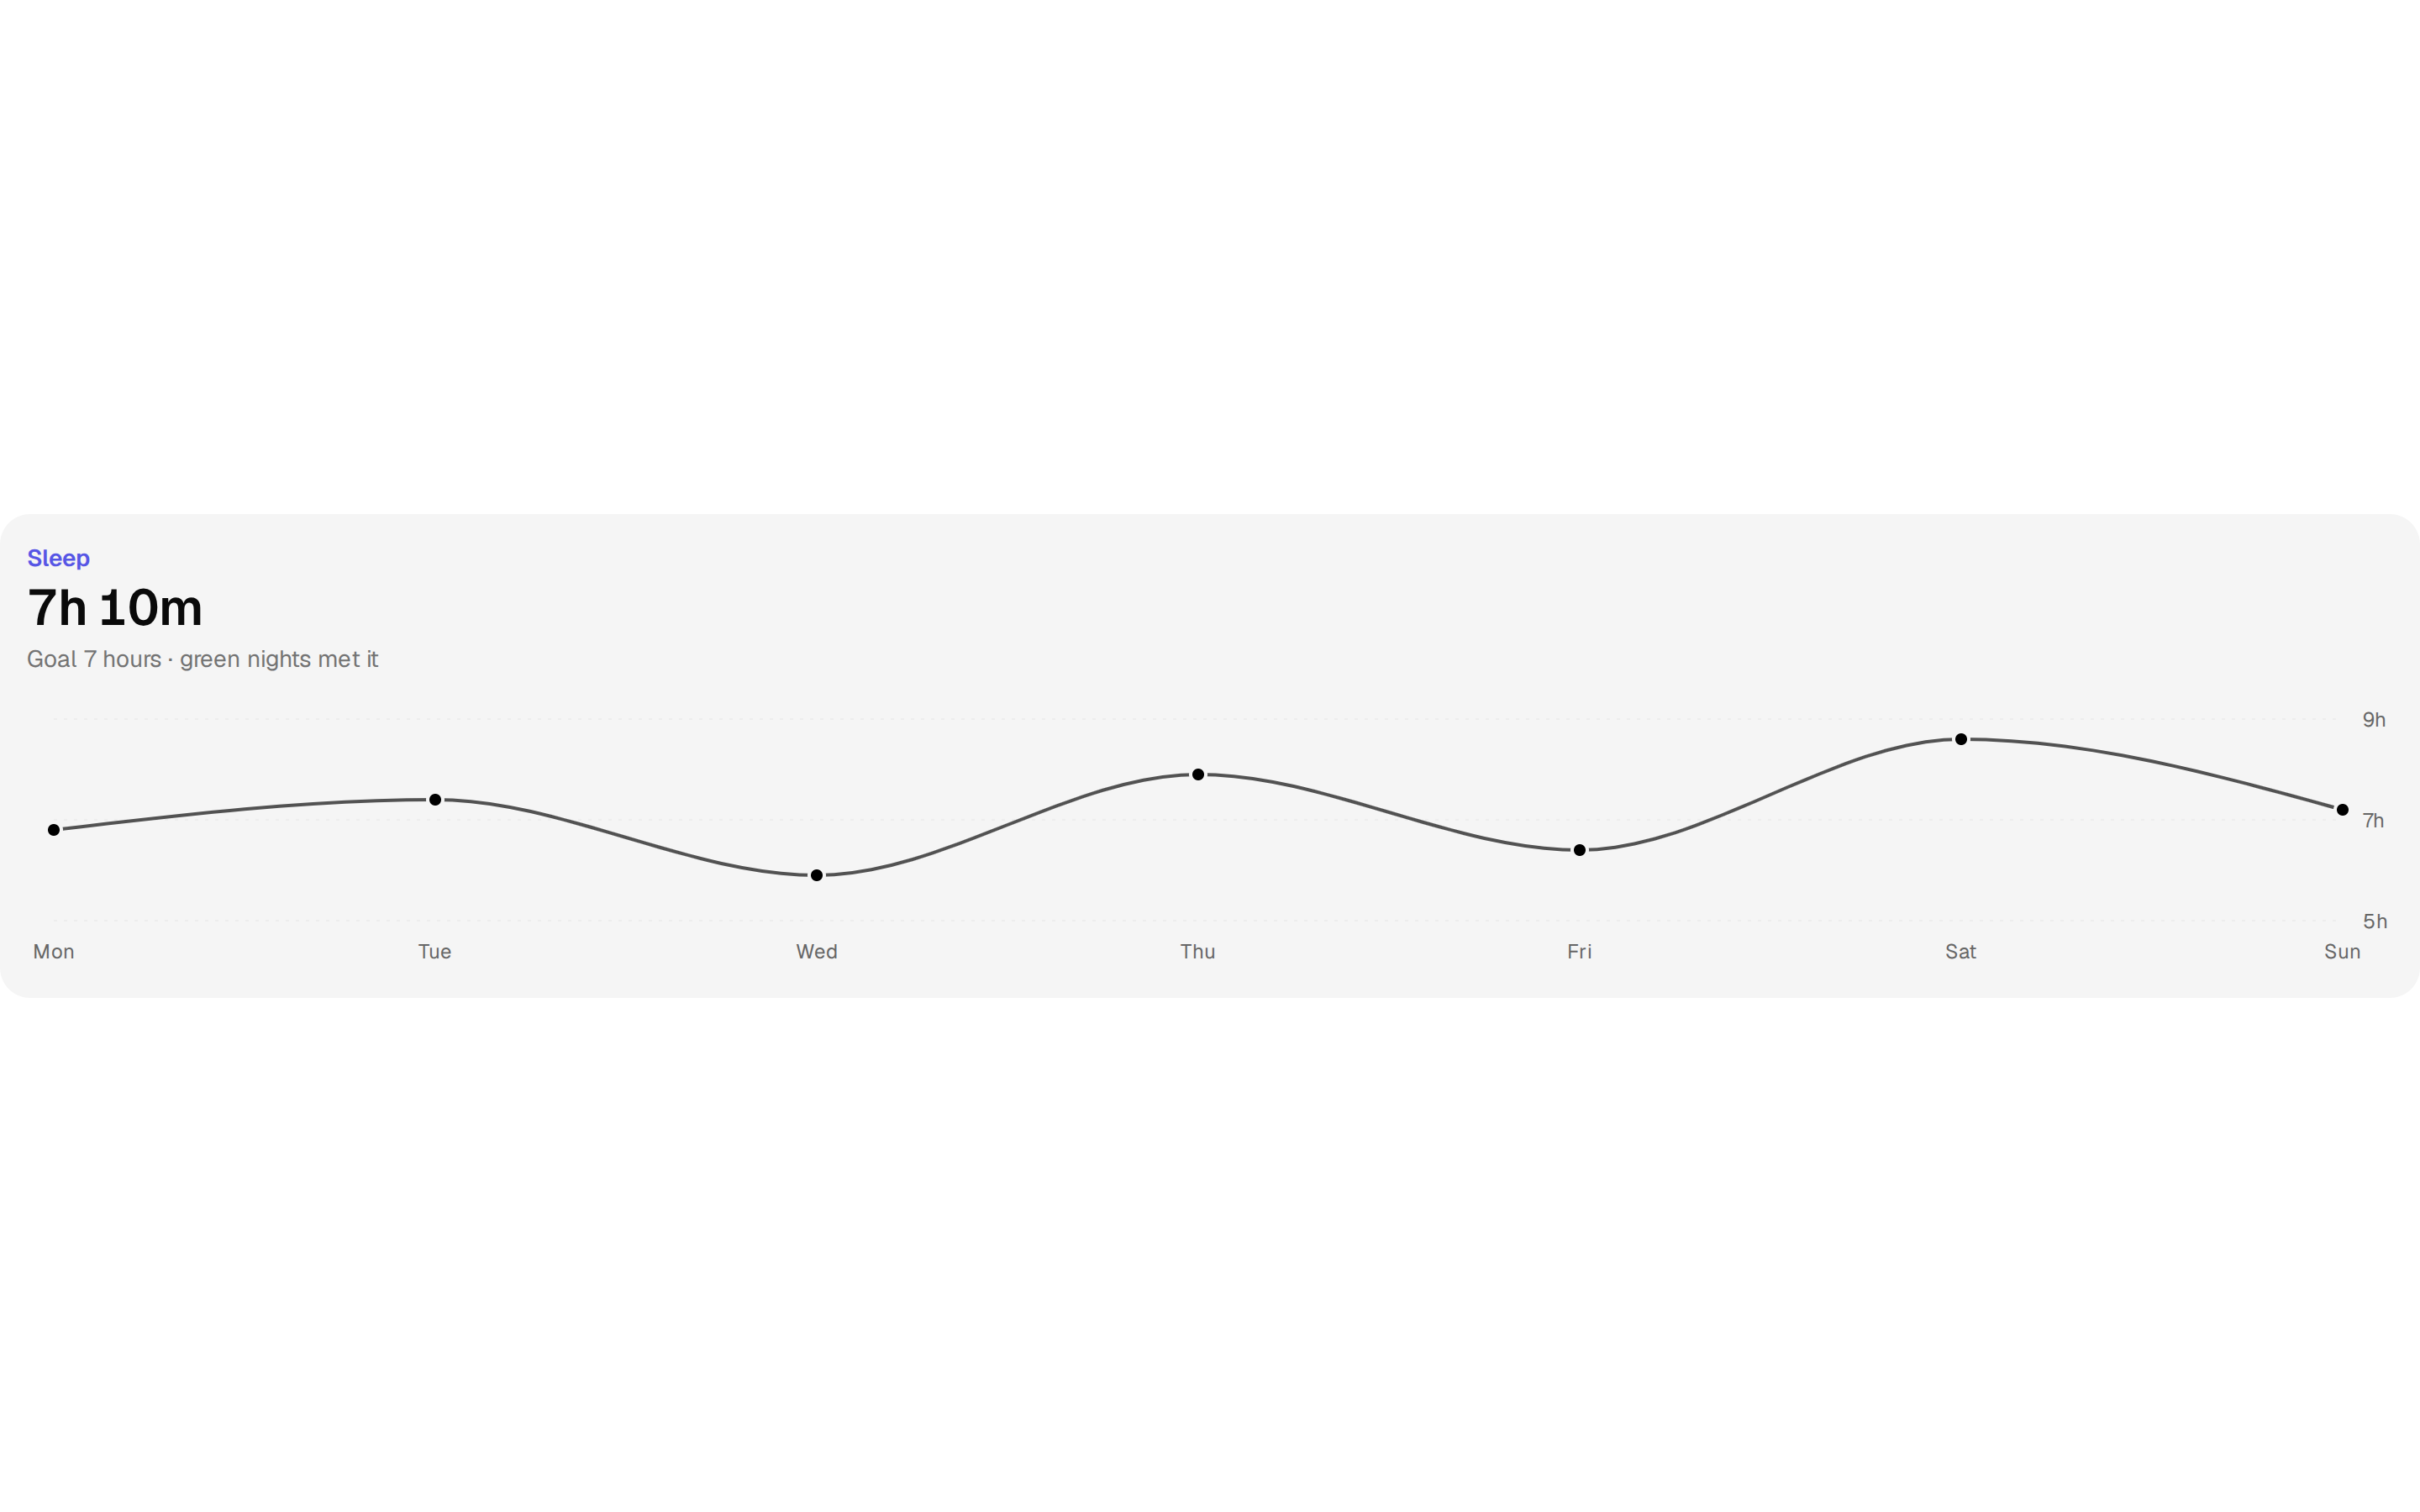
A weight trend with a dot at every monthly reading and a fixed value axis on the right.
@esuiss
A weight trend with a dot at every monthly reading and a fixed value axis on the right.
@esuiss
components/charts/line-chart-dots.tsx
"use client"

import { CartesianGrid, Line, LineChart, XAxis, YAxis } from "recharts"

import { Card, CardContent, CardHeader } from "@/components/ui/card"
import {
  type ChartConfig,
  ChartContainer,
  ChartTooltip,
  ChartTooltipContent,
} from "@/components/ui/chart"

const chartData = [
  82.4, 81.6, 81.9, 80.8, 80.1, 79.6, 79.8, 78.9, 78.4, 77.9,
].map((weight, index) => ({
  month: new Intl.DateTimeFormat("en-US", { month: "short" }).format(
    new Date(2026, index, 1)
  ),
  weight,
}))

const chartConfig = {
  weight: { label: "Weight", color: "var(--color-purple-500)" },
} satisfies ChartConfig

export function LineChartDots() {
  return (
    <Card variant="filled" size="sm">
      <CardHeader className="gap-0.5">
        <p className="text-sm font-semibold text-[color-mix(in_oklab,var(--color-purple-500),var(--foreground)_15%)] dark:text-purple-500">
          Weight
        </p>
        <p className="flex items-baseline gap-1">
          <span className="text-3xl font-semibold tracking-tight tabular-nums">
            77.9
          </span>
          <span className="text-base font-semibold text-muted-foreground">
            kg
          </span>
        </p>
        <p className="text-sm text-muted-foreground">
          Down 4.5 kg since January
        </p>
      </CardHeader>
      <CardContent>
        <ChartContainer
          config={chartConfig}
          className="aspect-auto h-40 w-full"
        >
          <LineChart
            accessibilityLayer
            data={chartData}
            margin={{ top: 10, right: 4, left: 12, bottom: 0 }}
          >
            <CartesianGrid vertical={false} strokeDasharray="2 4" />
            <XAxis
              dataKey="month"
              tickLine={false}
              axisLine={false}
              tickMargin={8}
              interval={2}
            />
            <YAxis
              orientation="right"
              tickLine={false}
              axisLine={false}
              tickMargin={6}
              width="auto"
              domain={[76, 84]}
              ticks={[76, 80, 84]}
            />
            <ChartTooltip
              content={
                <ChartTooltipContent
                  hideIndicator
                  formatter={(value) => (
                    <span className="font-semibold tabular-nums">
                      {value} kg
                    </span>
                  )}
                />
              }
            />
            <Line
              dataKey="weight"
              type="linear"
              stroke="var(--color-weight)"
              strokeWidth={2}
              dot={{ r: 3.5, fill: "var(--color-weight)", strokeWidth: 0 }}
              activeDot={{ r: 5 }}
            />
          </LineChart>
        </ChartContainer>
      </CardContent>
    </Card>
  )
}