Charts 2: revenue report
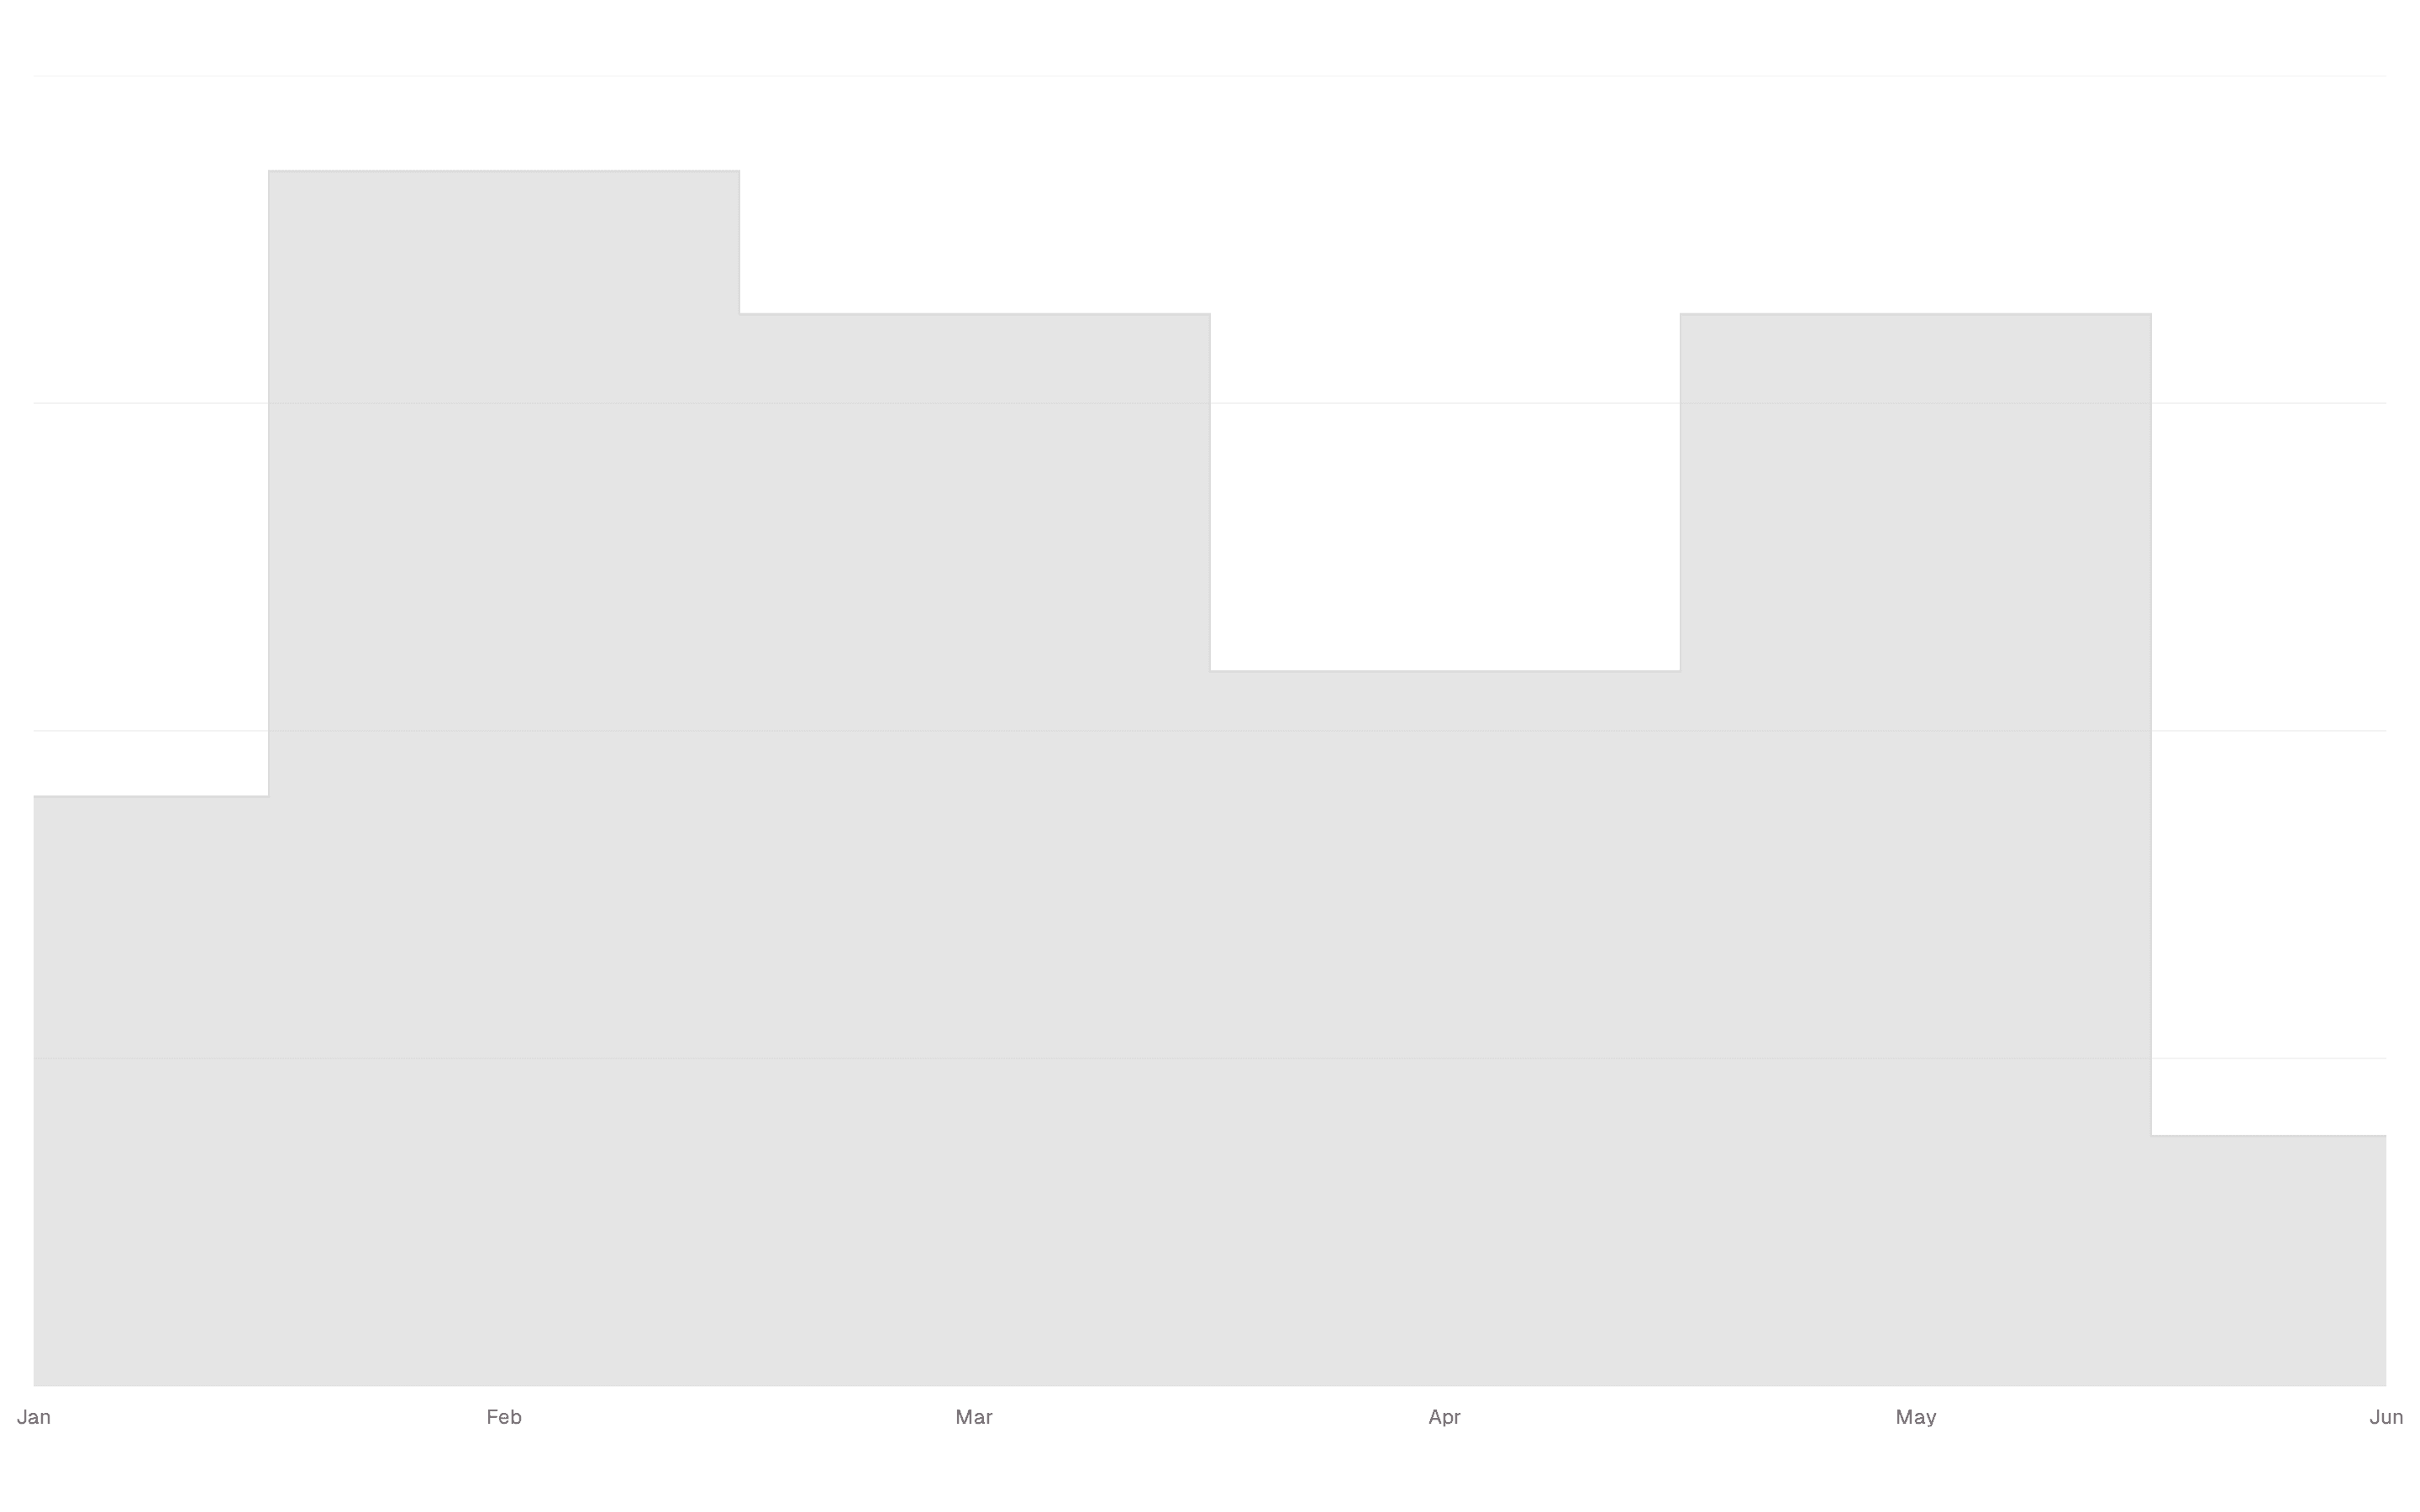
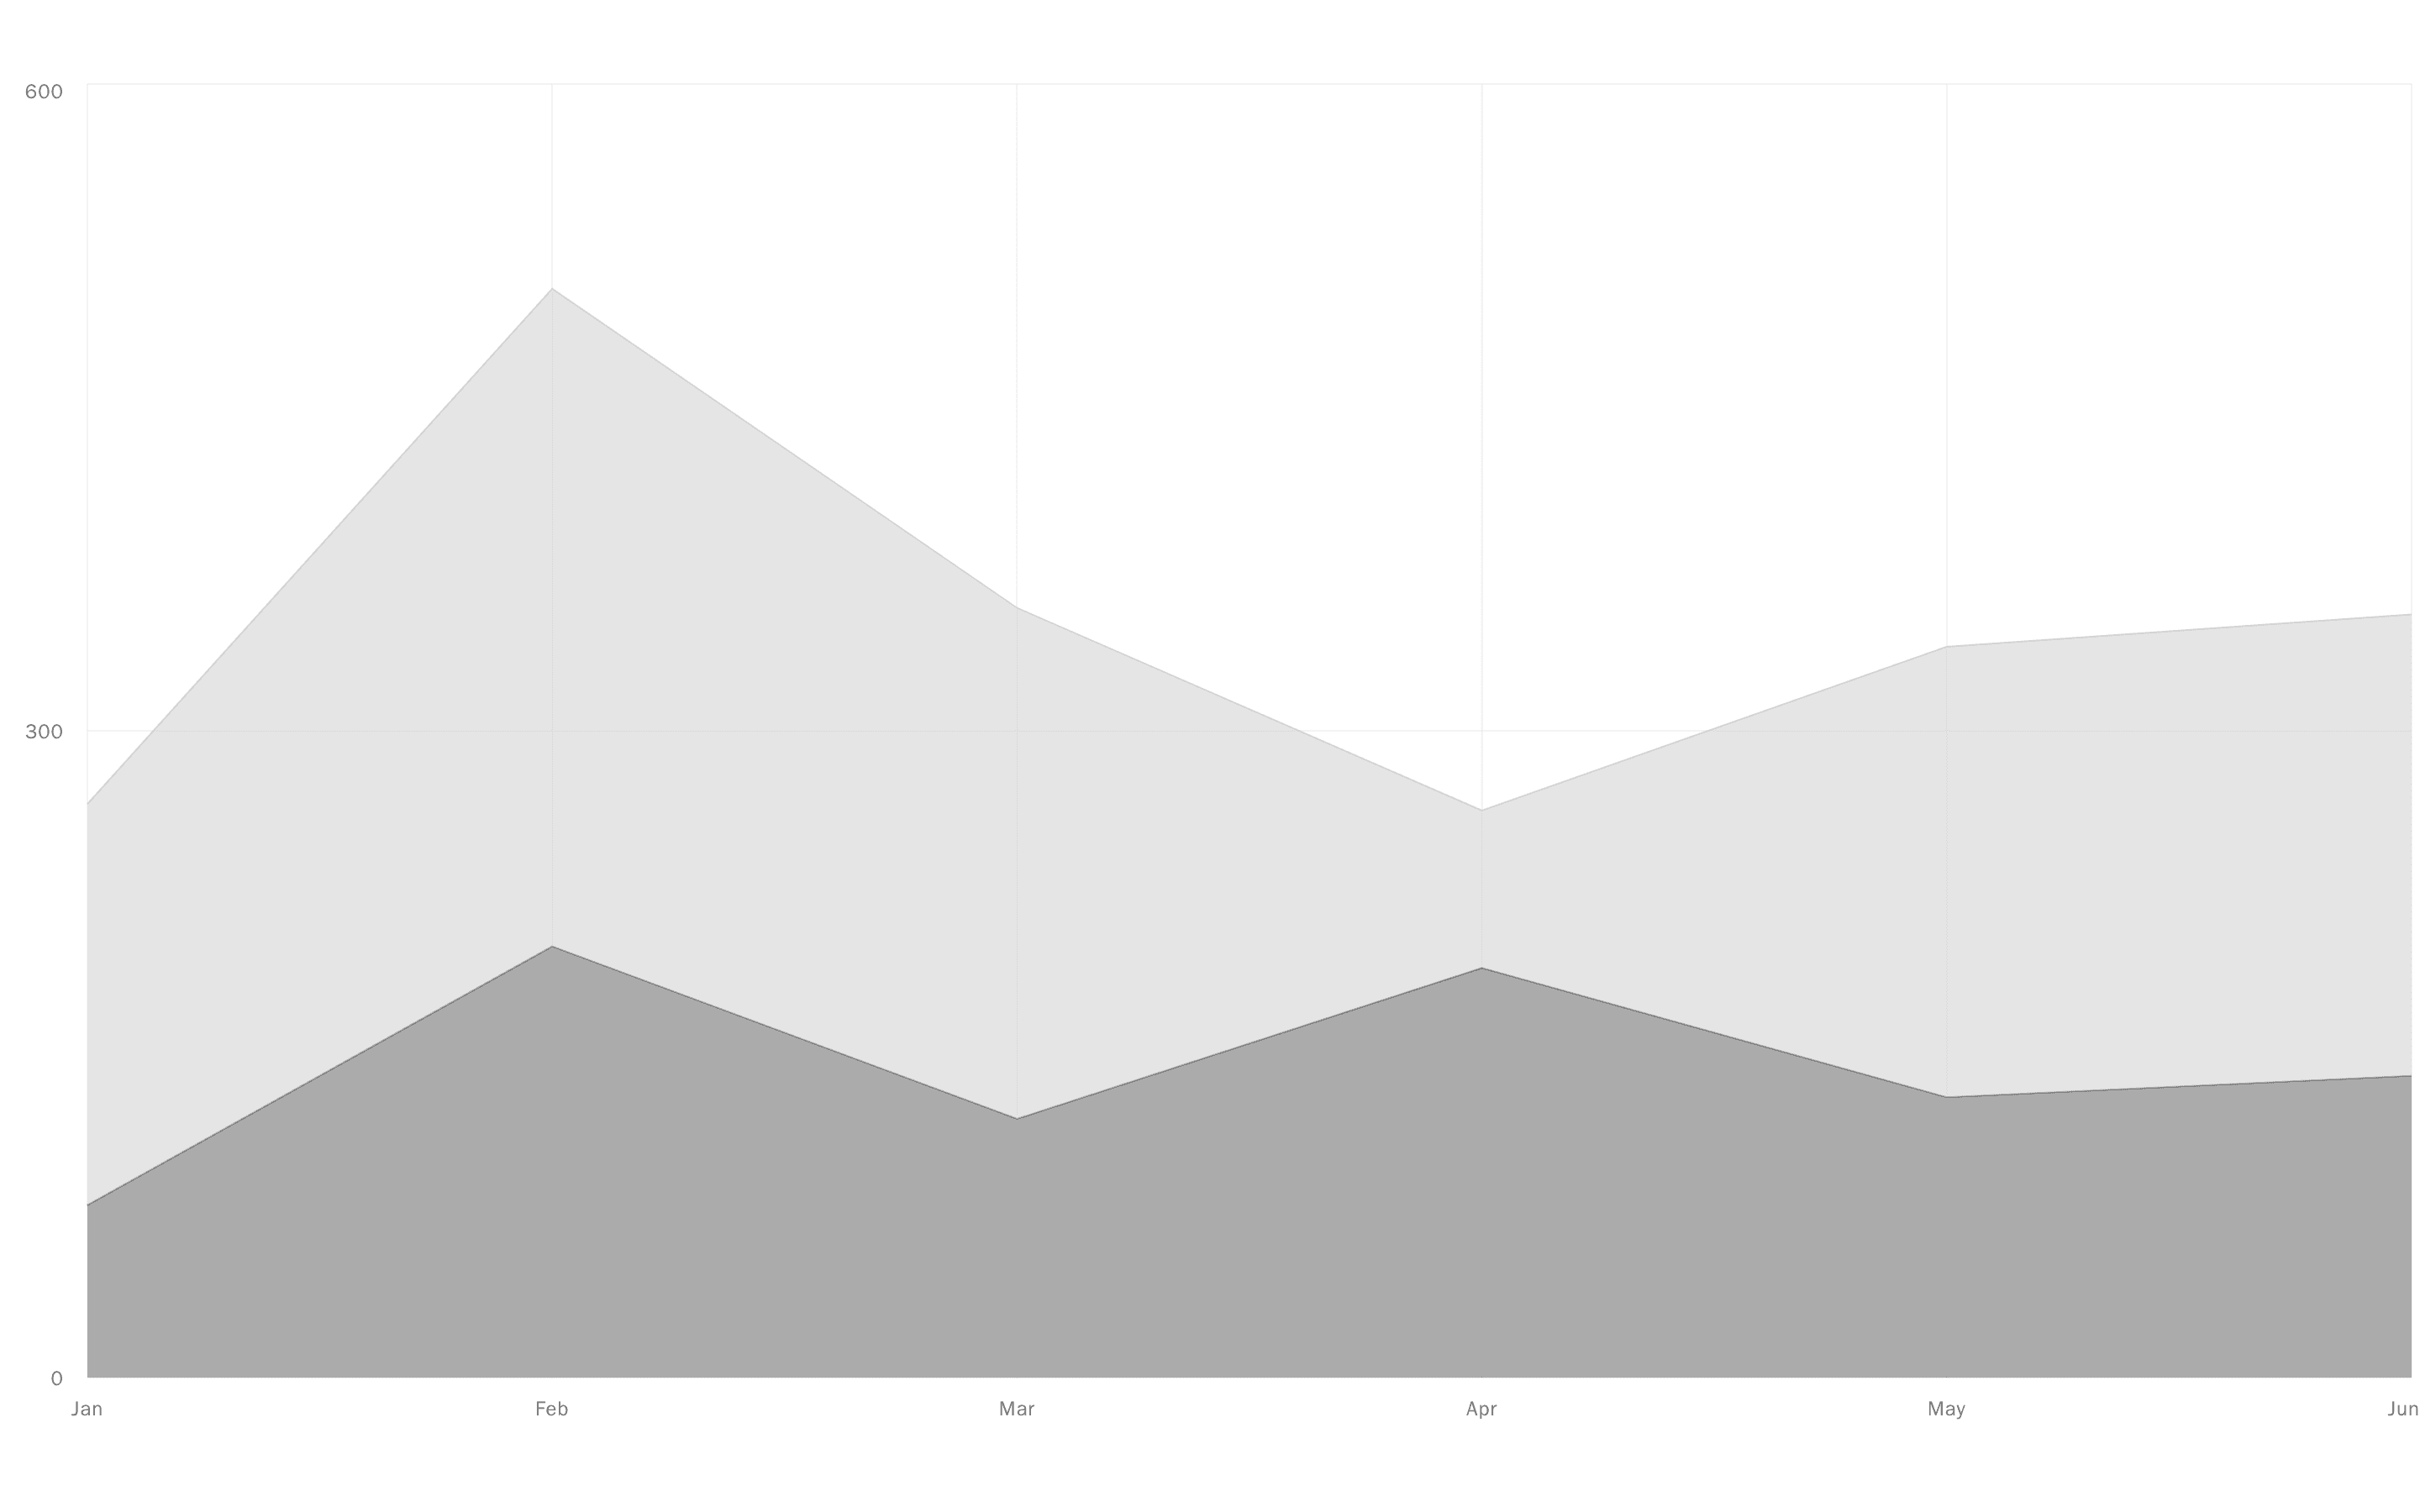
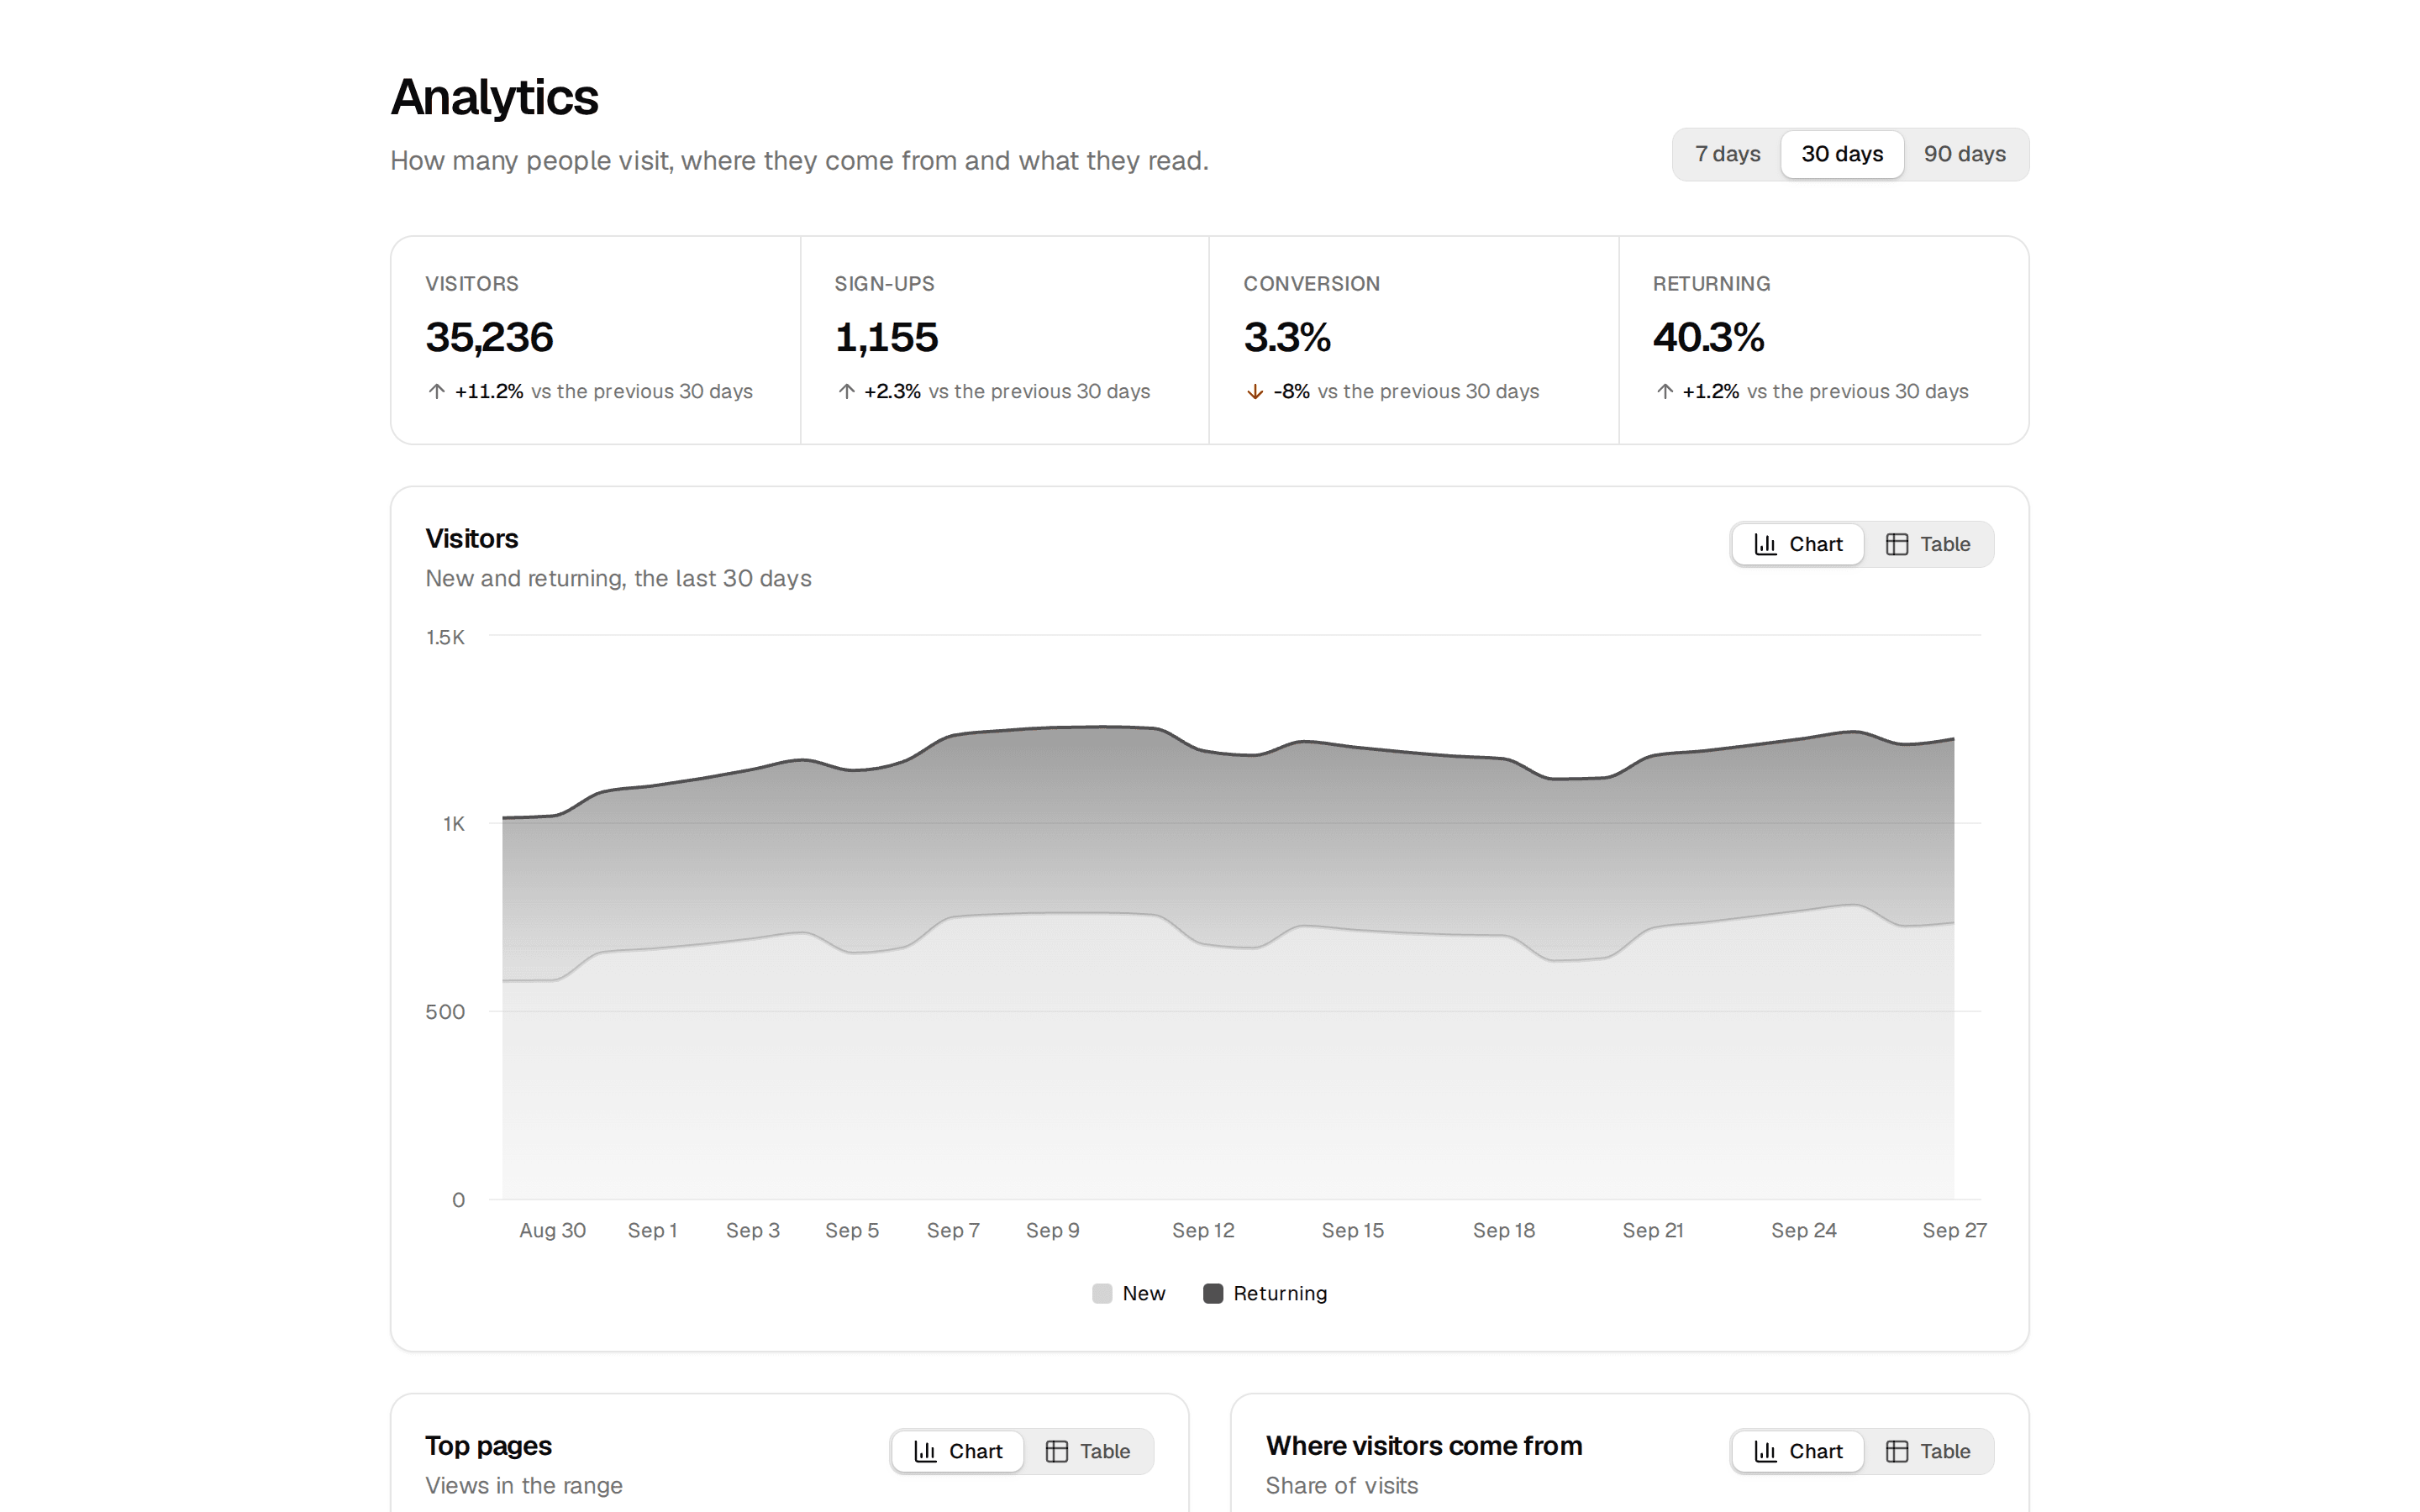
A revenue report: monthly recurring revenue, annual run rate, what was added last month and the largest plan, then revenue by plan as stacked columns and net revenue retention as a line against the 100% mark.
@ballmac
A revenue report: monthly recurring revenue, annual run rate, what was added last month and the largest plan, then revenue by plan as stacked columns and net revenue retention as a line against the 100% mark.
@ballmac
registry/ballmac/components/blocks/charts-2/charts-2.tsx
// Ballmac UI: Charts 2. https://ui.ballmac.com/blocks/charts-2
"use client"

import * as React from "react"
import { ArrowDown, ArrowUp, CircleDollarSign } from "lucide-react"

import { ChartBar } from "@/components/ballmac/chart-bar"
import { ChartLine } from "@/components/ballmac/chart-line"
import { KpiItem, KpiRow } from "@/components/ballmac/kpi-row"
import { Skeleton } from "@/components/ballmac/skeleton"
import { frameProps, StateView, type StateProps } from "@/components/ballmac/state-view"
import { cn } from "@/lib/utils"

/** One month of recurring revenue by plan, and what share of last year's revenue from the same customers is still there. */
type Charts2Month = { month: string; starter: number; pro: number; team: number; retention: number }

type Charts2Props = Omit<React.ComponentProps<"section">, "title"> &
  StateProps & {
    title?: string
    description?: string
    /** One row per month, oldest first, with the month written for people ("Jan"). At least two. */
    months?: Charts2Month[]
    /** ISO currency code. */
    currency?: string
    locale?: string
  }

const sample: Charts2Month[] = [
  { month: "Nov", starter: 12400, pro: 31800, team: 18200, retention: 101 },
  { month: "Dec", starter: 12900, pro: 33600, team: 19900, retention: 102 },
  { month: "Jan", starter: 13300, pro: 34900, team: 22400, retention: 100 },
  { month: "Feb", starter: 13600, pro: 36800, team: 24100, retention: 103 },
  { month: "Mar", starter: 14100, pro: 38900, team: 26800, retention: 105 },
  { month: "Apr", starter: 14200, pro: 41200, team: 29300, retention: 104 },
  { month: "May", starter: 14800, pro: 43100, team: 32600, retention: 106 },
  { month: "Jun", starter: 15100, pro: 45800, team: 35400, retention: 108 },
  { month: "Jul", starter: 15400, pro: 47200, team: 38900, retention: 107 },
  { month: "Aug", starter: 15200, pro: 49600, team: 42100, retention: 109 },
  { month: "Sep", starter: 15900, pro: 52300, team: 45800, retention: 111 },
  { month: "Oct", starter: 16300, pro: 54700, team: 49600, retention: 112 },
]

function Skel() {
  return (
    <div aria-hidden="true" className="grid gap-6">
      <Skeleton className="h-24 rounded-xl" />
      <Skeleton className="aspect-[2/1] w-full rounded-xl" />
      <Skeleton className="aspect-[2/1] w-full rounded-xl" />
    </div>
  )
}

/**
 * A revenue report: monthly recurring revenue, annual run rate, what was added last month and the best plan, then revenue by plan as stacked columns and
 * net revenue retention as a line against the 100% mark. Every figure is worked out from the monthly rows, and each chart has a table view and a CSV download.
 */
function Charts2({
  title = "Revenue",
  description = "Recurring revenue by plan, and whether existing customers spend more or less over time.",
  months = sample,
  currency = "USD",
  locale = "en",
  state = "ready",
  onRetry,
  emptyState,
  errorState,
  className,
  ...props
}: Charts2Props) {
  const id = React.useId()
  const rows = state === "empty" ? [] : months
  const money = React.useMemo(() => new Intl.NumberFormat(locale, { style: "currency", currency, maximumFractionDigits: 0 }), [locale, currency])
  const compact = React.useMemo(() => new Intl.NumberFormat(locale, { style: "currency", currency, notation: "compact", maximumFractionDigits: 1 }), [locale, currency])
  const pct = React.useMemo(() => new Intl.NumberFormat(locale, { style: "percent", maximumFractionDigits: 1, signDisplay: "exceptZero" }), [locale])
  const total = (m: Charts2Month) => m.starter + m.pro + m.team

  const last = rows.at(-1)
  const prev = rows.at(-2)
  const mrr = last ? total(last) : 0
  const added = last && prev ? total(last) - total(prev) : null
  const plans = [
    { key: "starter", label: "Starter" },
    { key: "pro", label: "Pro" },
    { key: "team", label: "Team" },
  ] as const
  const top = last ? [...plans].sort((a, b) => last[b.key] - last[a.key])[0]! : null

  const content = !last ? null : (
    <div className="grid gap-6">
      <KpiRow columns={4} className="w-full">
        <KpiItem label="Monthly recurring revenue" value={money.format(mrr)} detail={added === null ? undefined : <span className="inline-flex items-center gap-1">{added >= 0 ? <ArrowUp aria-hidden="true" className="size-3.5 text-chart-2" /> : <ArrowDown aria-hidden="true" className="text-destructive size-3.5" />}<span className="text-foreground font-medium tabular-nums">{pct.format(added / (total(prev!) || 1))}</span><span className="sr-only">{added >= 0 ? " up" : " down"}</span> from {prev!.month}</span>} />
        <KpiItem label="Annual run rate" value={money.format(mrr * 12)} detail="Monthly revenue times twelve" />
        <KpiItem label={`Added in ${last.month}`} value={added === null ? "–" : `${added >= 0 ? "+" : "−"}${money.format(Math.abs(added))}`} detail={added === null ? "No earlier month" : "Net of what customers dropped"} />
        <KpiItem label="Largest plan" value={top!.label} detail={`${money.format(last[top!.key])} a month, ${new Intl.NumberFormat(locale, { style: "percent", maximumFractionDigits: 0 }).format(last[top!.key] / (mrr || 1))} of the total`} />
      </KpiRow>

      <ChartBar
        title="Revenue by plan"
        description={`Monthly recurring revenue, ${rows[0]!.month} to ${last.month}`}
        data={rows}
        xKey="month"
        categoryLabel="Month"
        stack="stacked"
        series={plans.map((p) => ({ key: p.key, label: p.label }))}
        axisFormatter={(v) => compact.format(v)}
        valueFormatter={(v) => money.format(v)}
        locale={locale}
        aspect="panorama"
        gap="tight"
      />

      <ChartLine
        title="Net revenue retention"
        description="Revenue from customers who were here a year ago, against what they paid then. Above 100% means they grow."
        data={rows}
        xKey="month"
        categoryLabel="Month"
        series={[{ key: "retention", label: "Retention", color: "var(--chart-2)" }]}
        yDomain={[90, 120]}
        yFormatter={(v) => `${v}%`}
        valueFormatter={(v) => `${v}%`}
        referenceLines={[{ y: 100, label: "100%: flat" }]}
        locale={locale}
        aspect="panorama"
        dots
      />
    </div>
  )

  return (
    <section data-slot="charts-2" data-state={state} aria-labelledby={`${id}-title`} className={cn("mx-auto w-full max-w-5xl px-4 py-10 sm:px-6", className)} {...frameProps(props)}>
      <header className="mb-8">
        <h1 id={`${id}-title`} className="text-3xl font-semibold tracking-[-0.035em] text-balance">
          {title}
        </h1>
        <p className="text-muted-foreground mt-2 max-w-2xl text-pretty">{description}</p>
      </header>
      <StateView
        state={state === "empty" || !rows.length ? "empty" : state === "loading" || state === "error" ? state : "ready"}
        onRetry={onRetry}
        label="Loading revenue"
        loading={<Skel />}
        empty={{ icon: <CircleDollarSign />, title: emptyState?.title ?? "No revenue yet", description: emptyState?.description ?? "Once you have paying customers, revenue and retention appear here.", action: emptyState?.action }}
        error={{ title: errorState?.title ?? "Revenue could not be loaded", description: errorState?.description ?? "Check your connection and try again.", ...errorState }}
      >
        {content}
      </StateView>
    </section>
  )
}

export { Charts2, type Charts2Props, type Charts2Month }