Area Chart Interactive
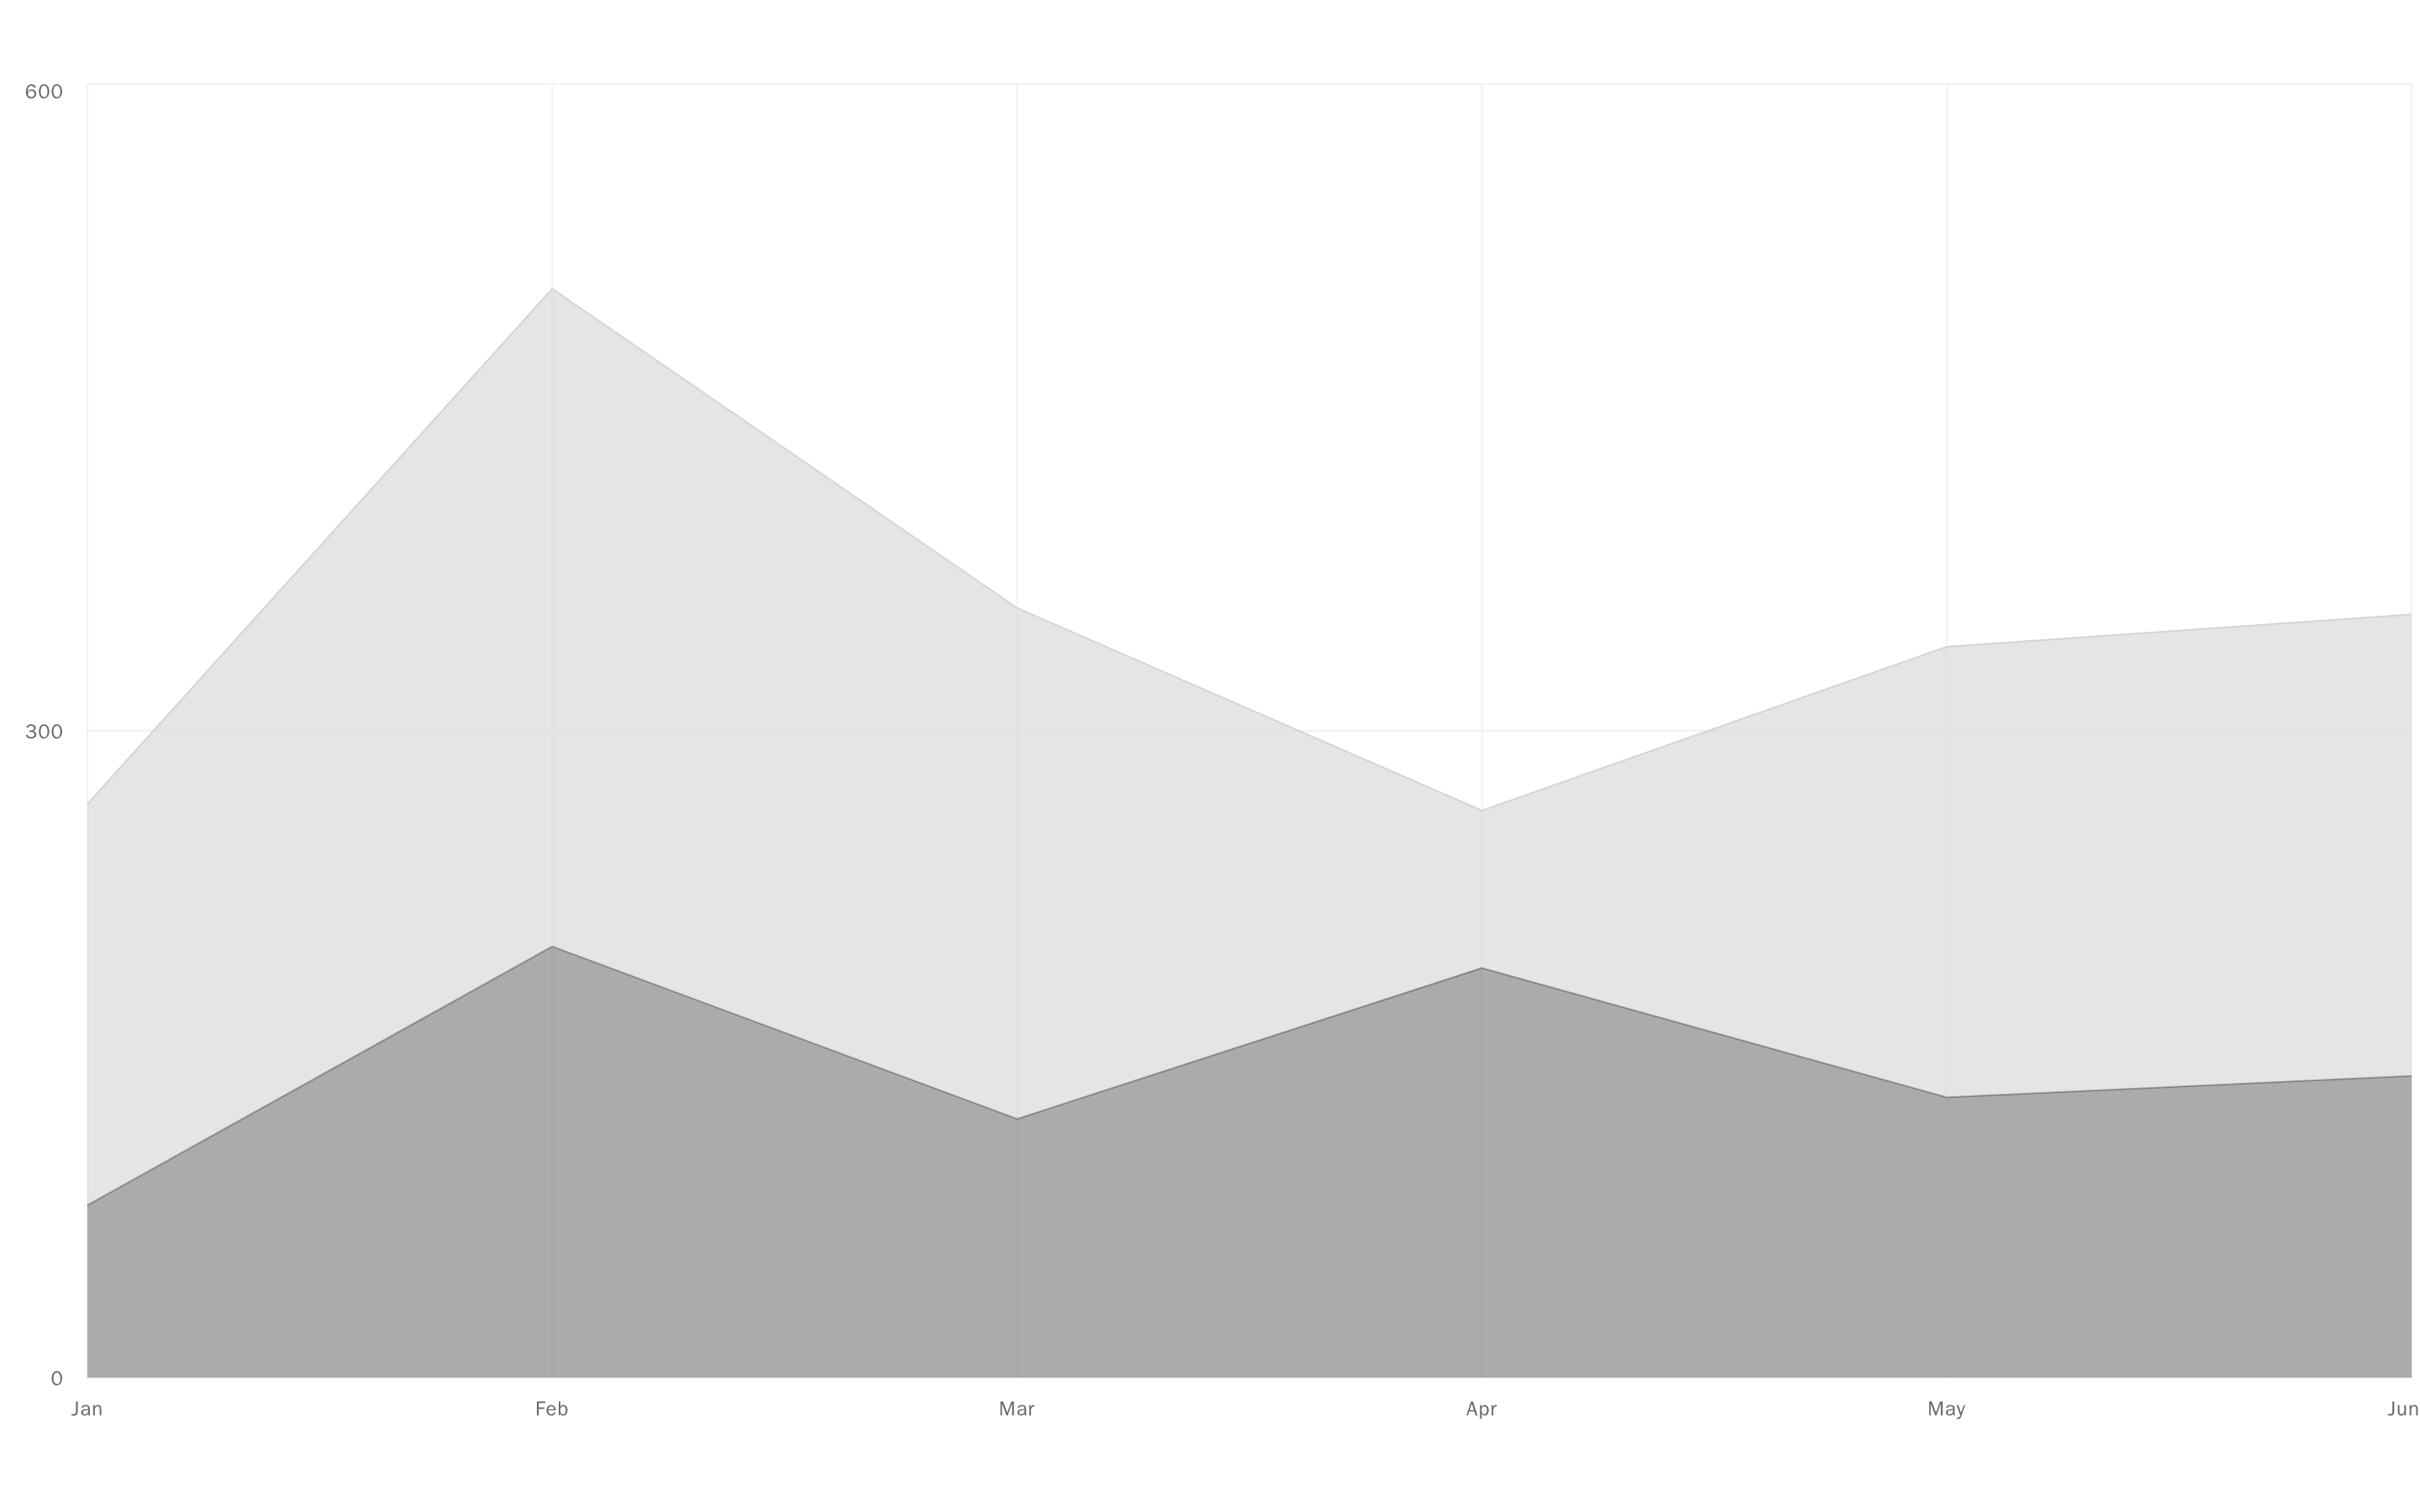
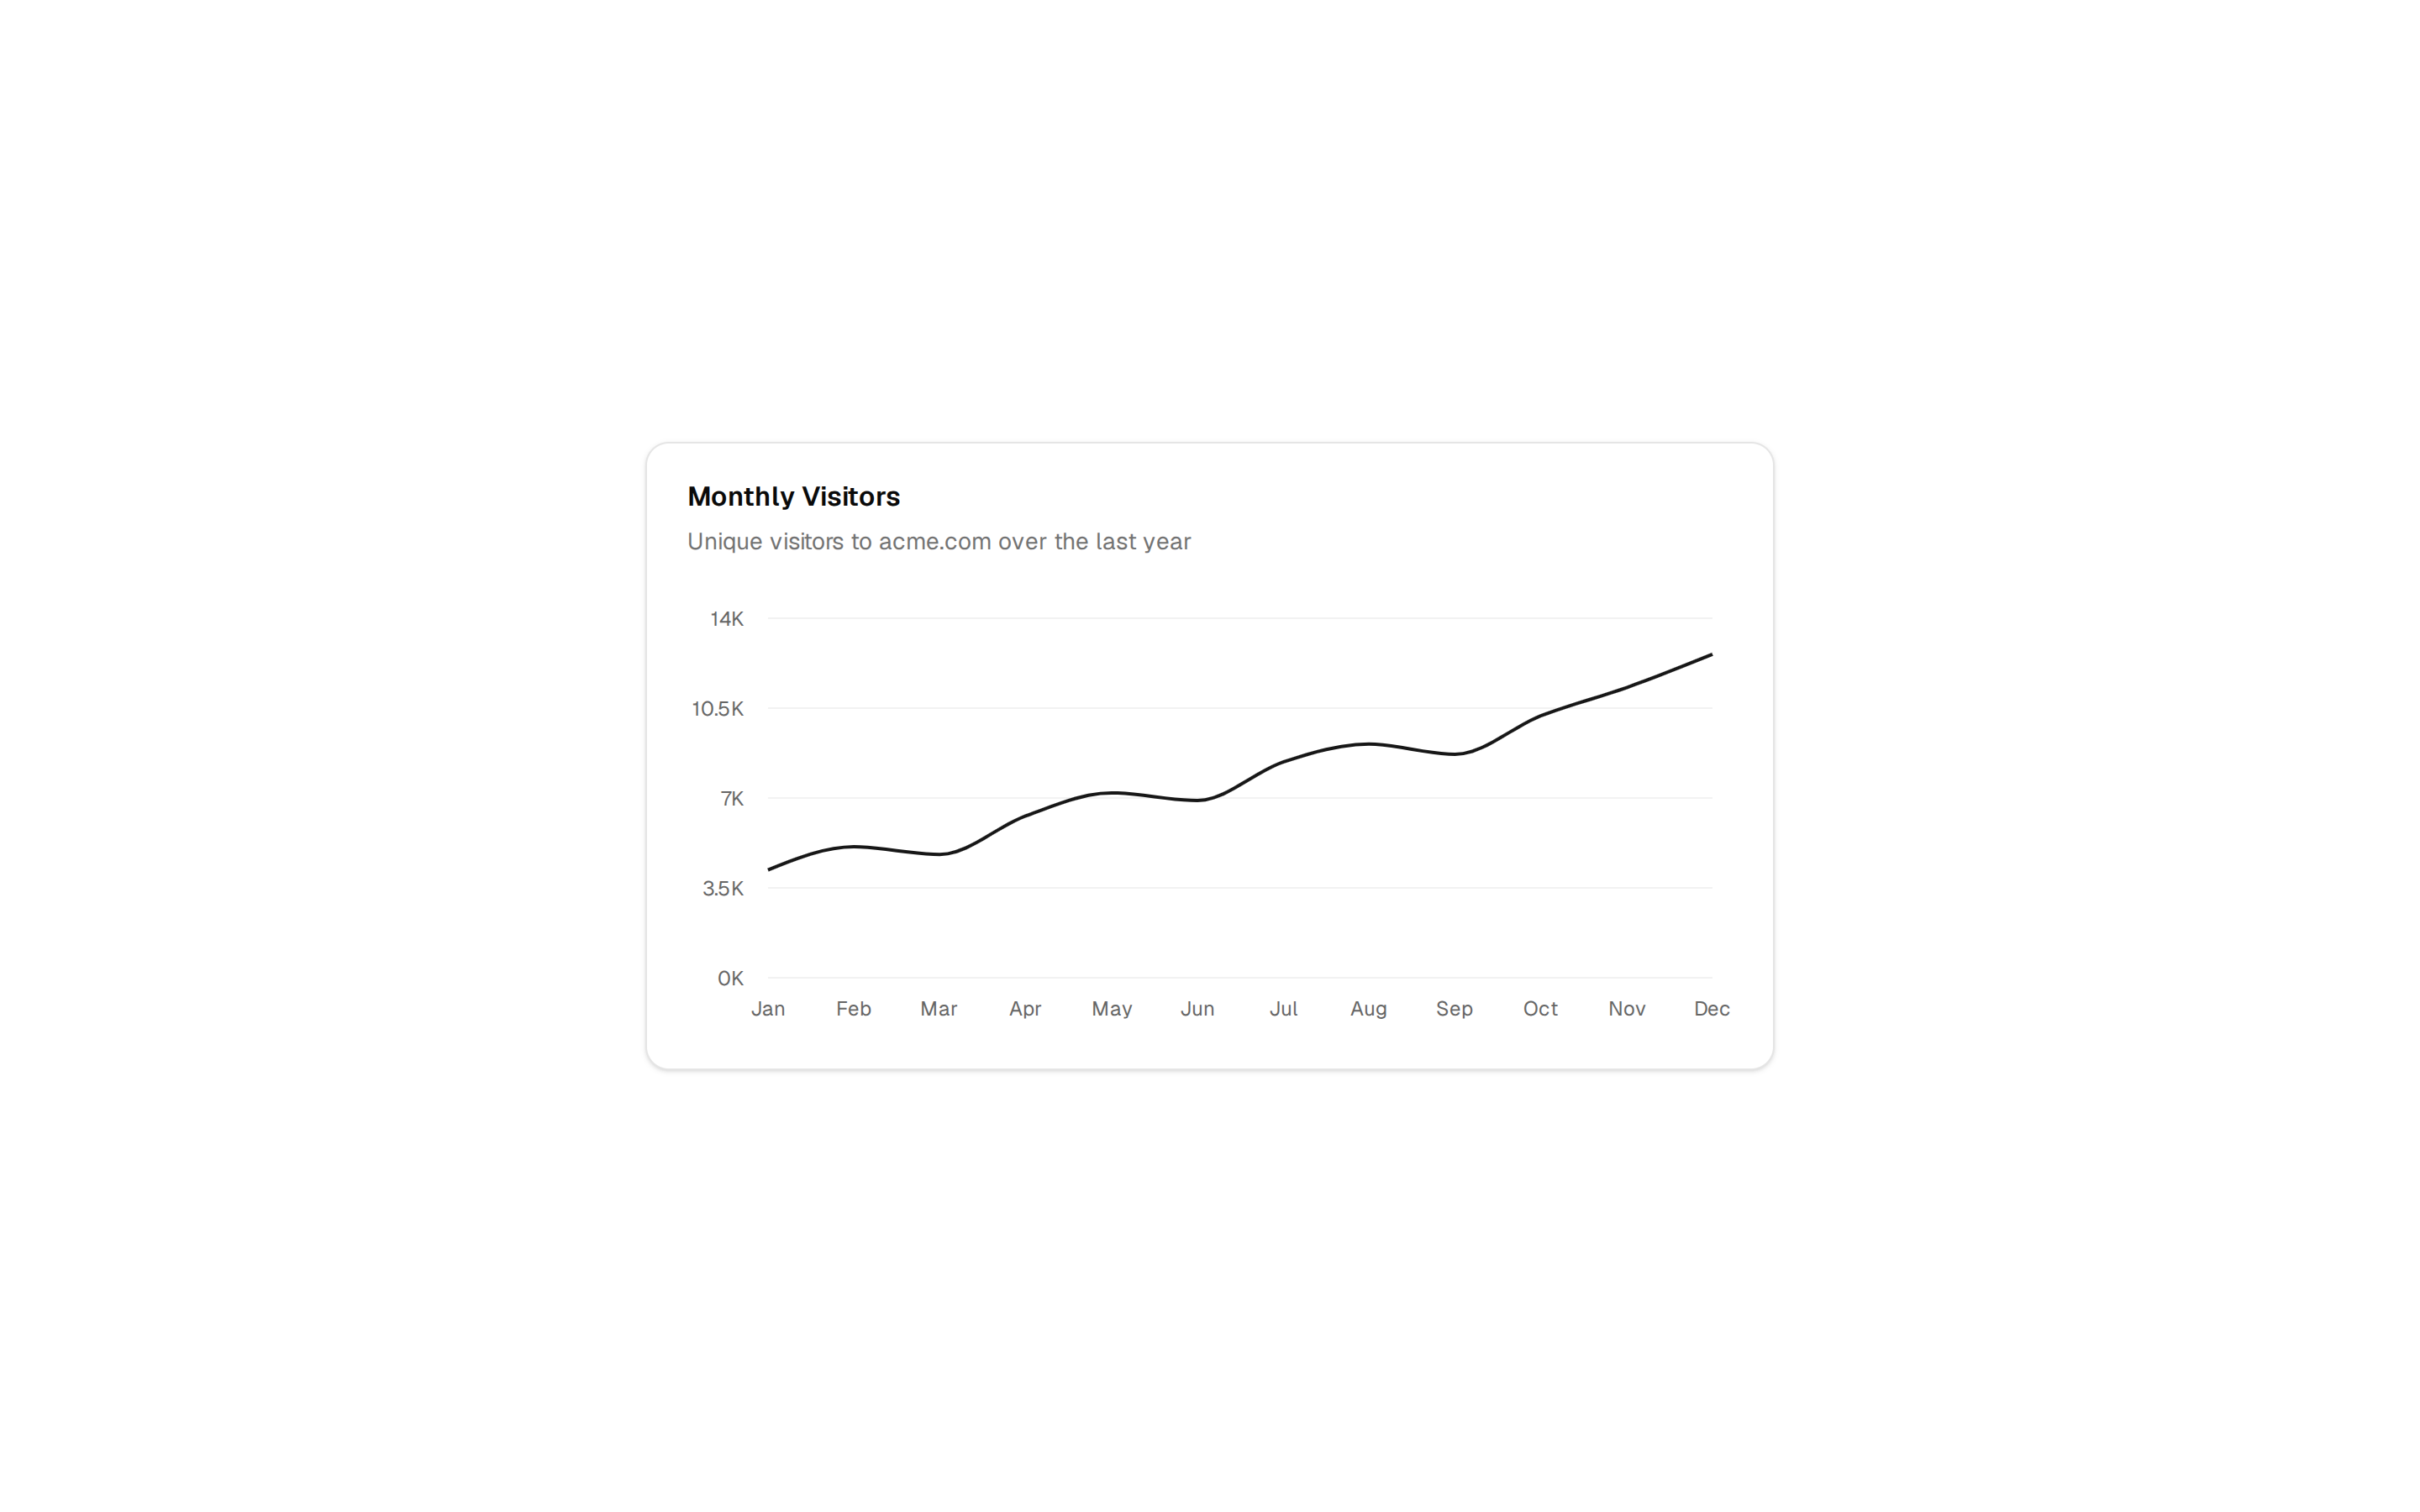
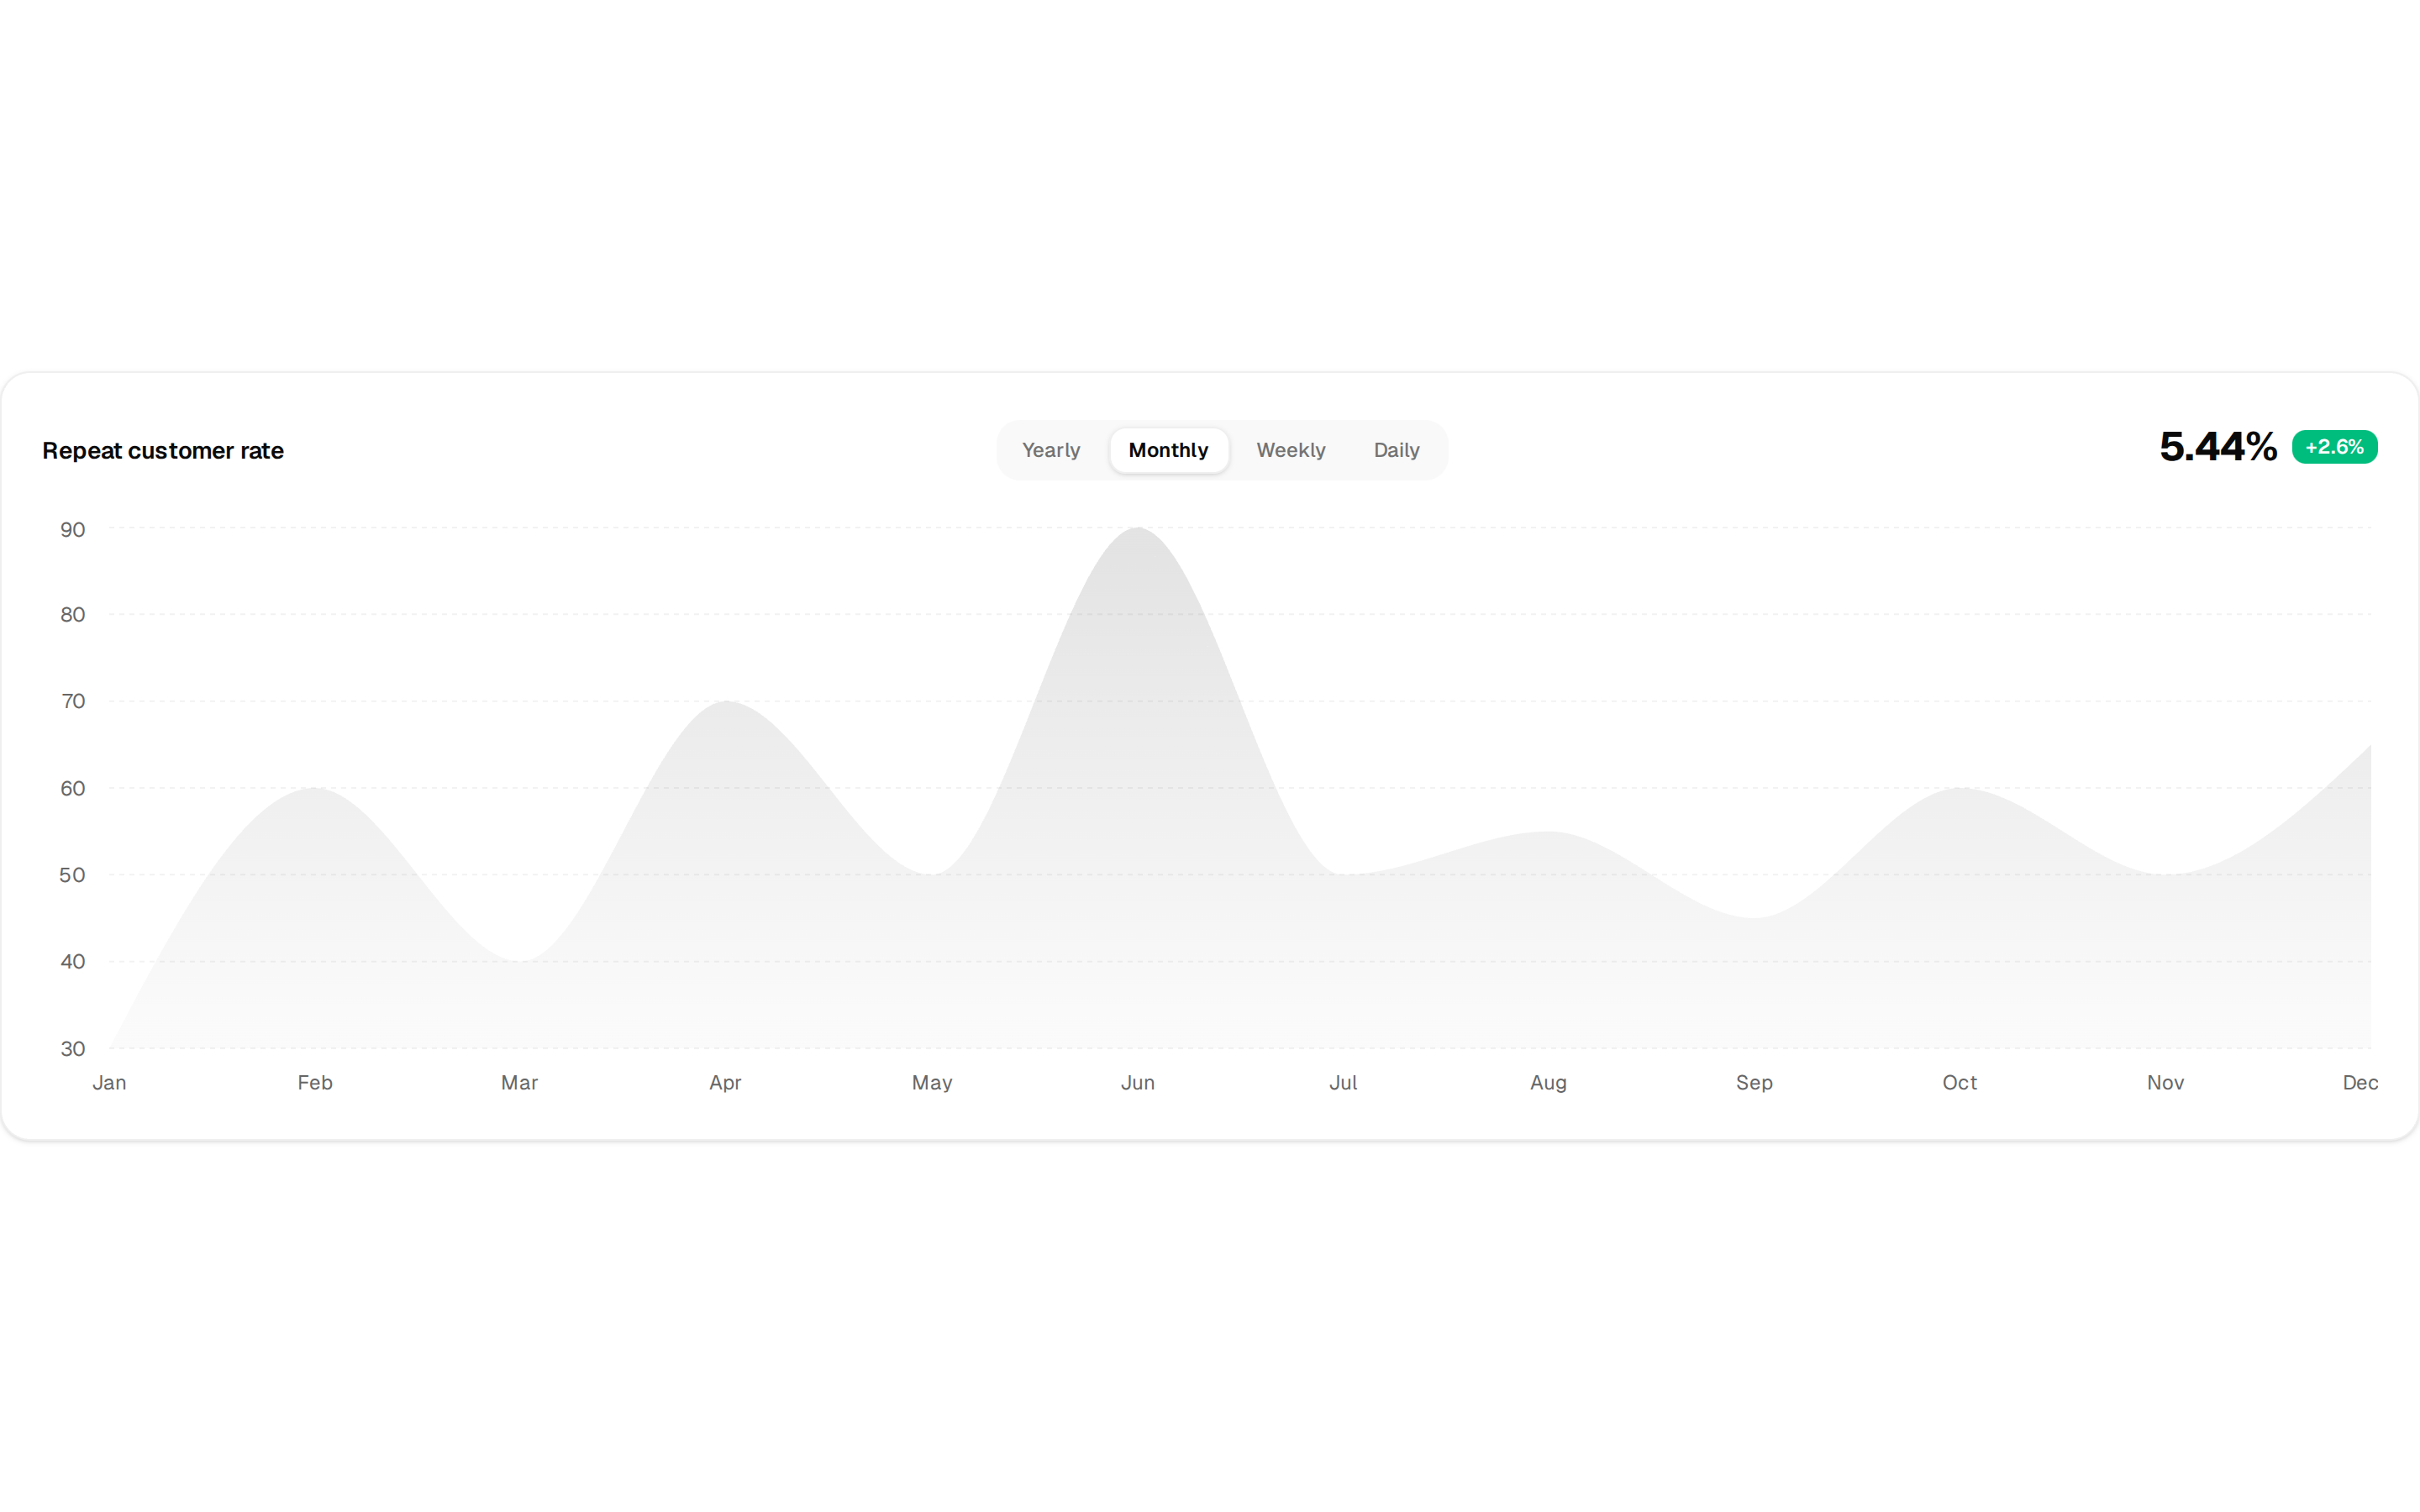
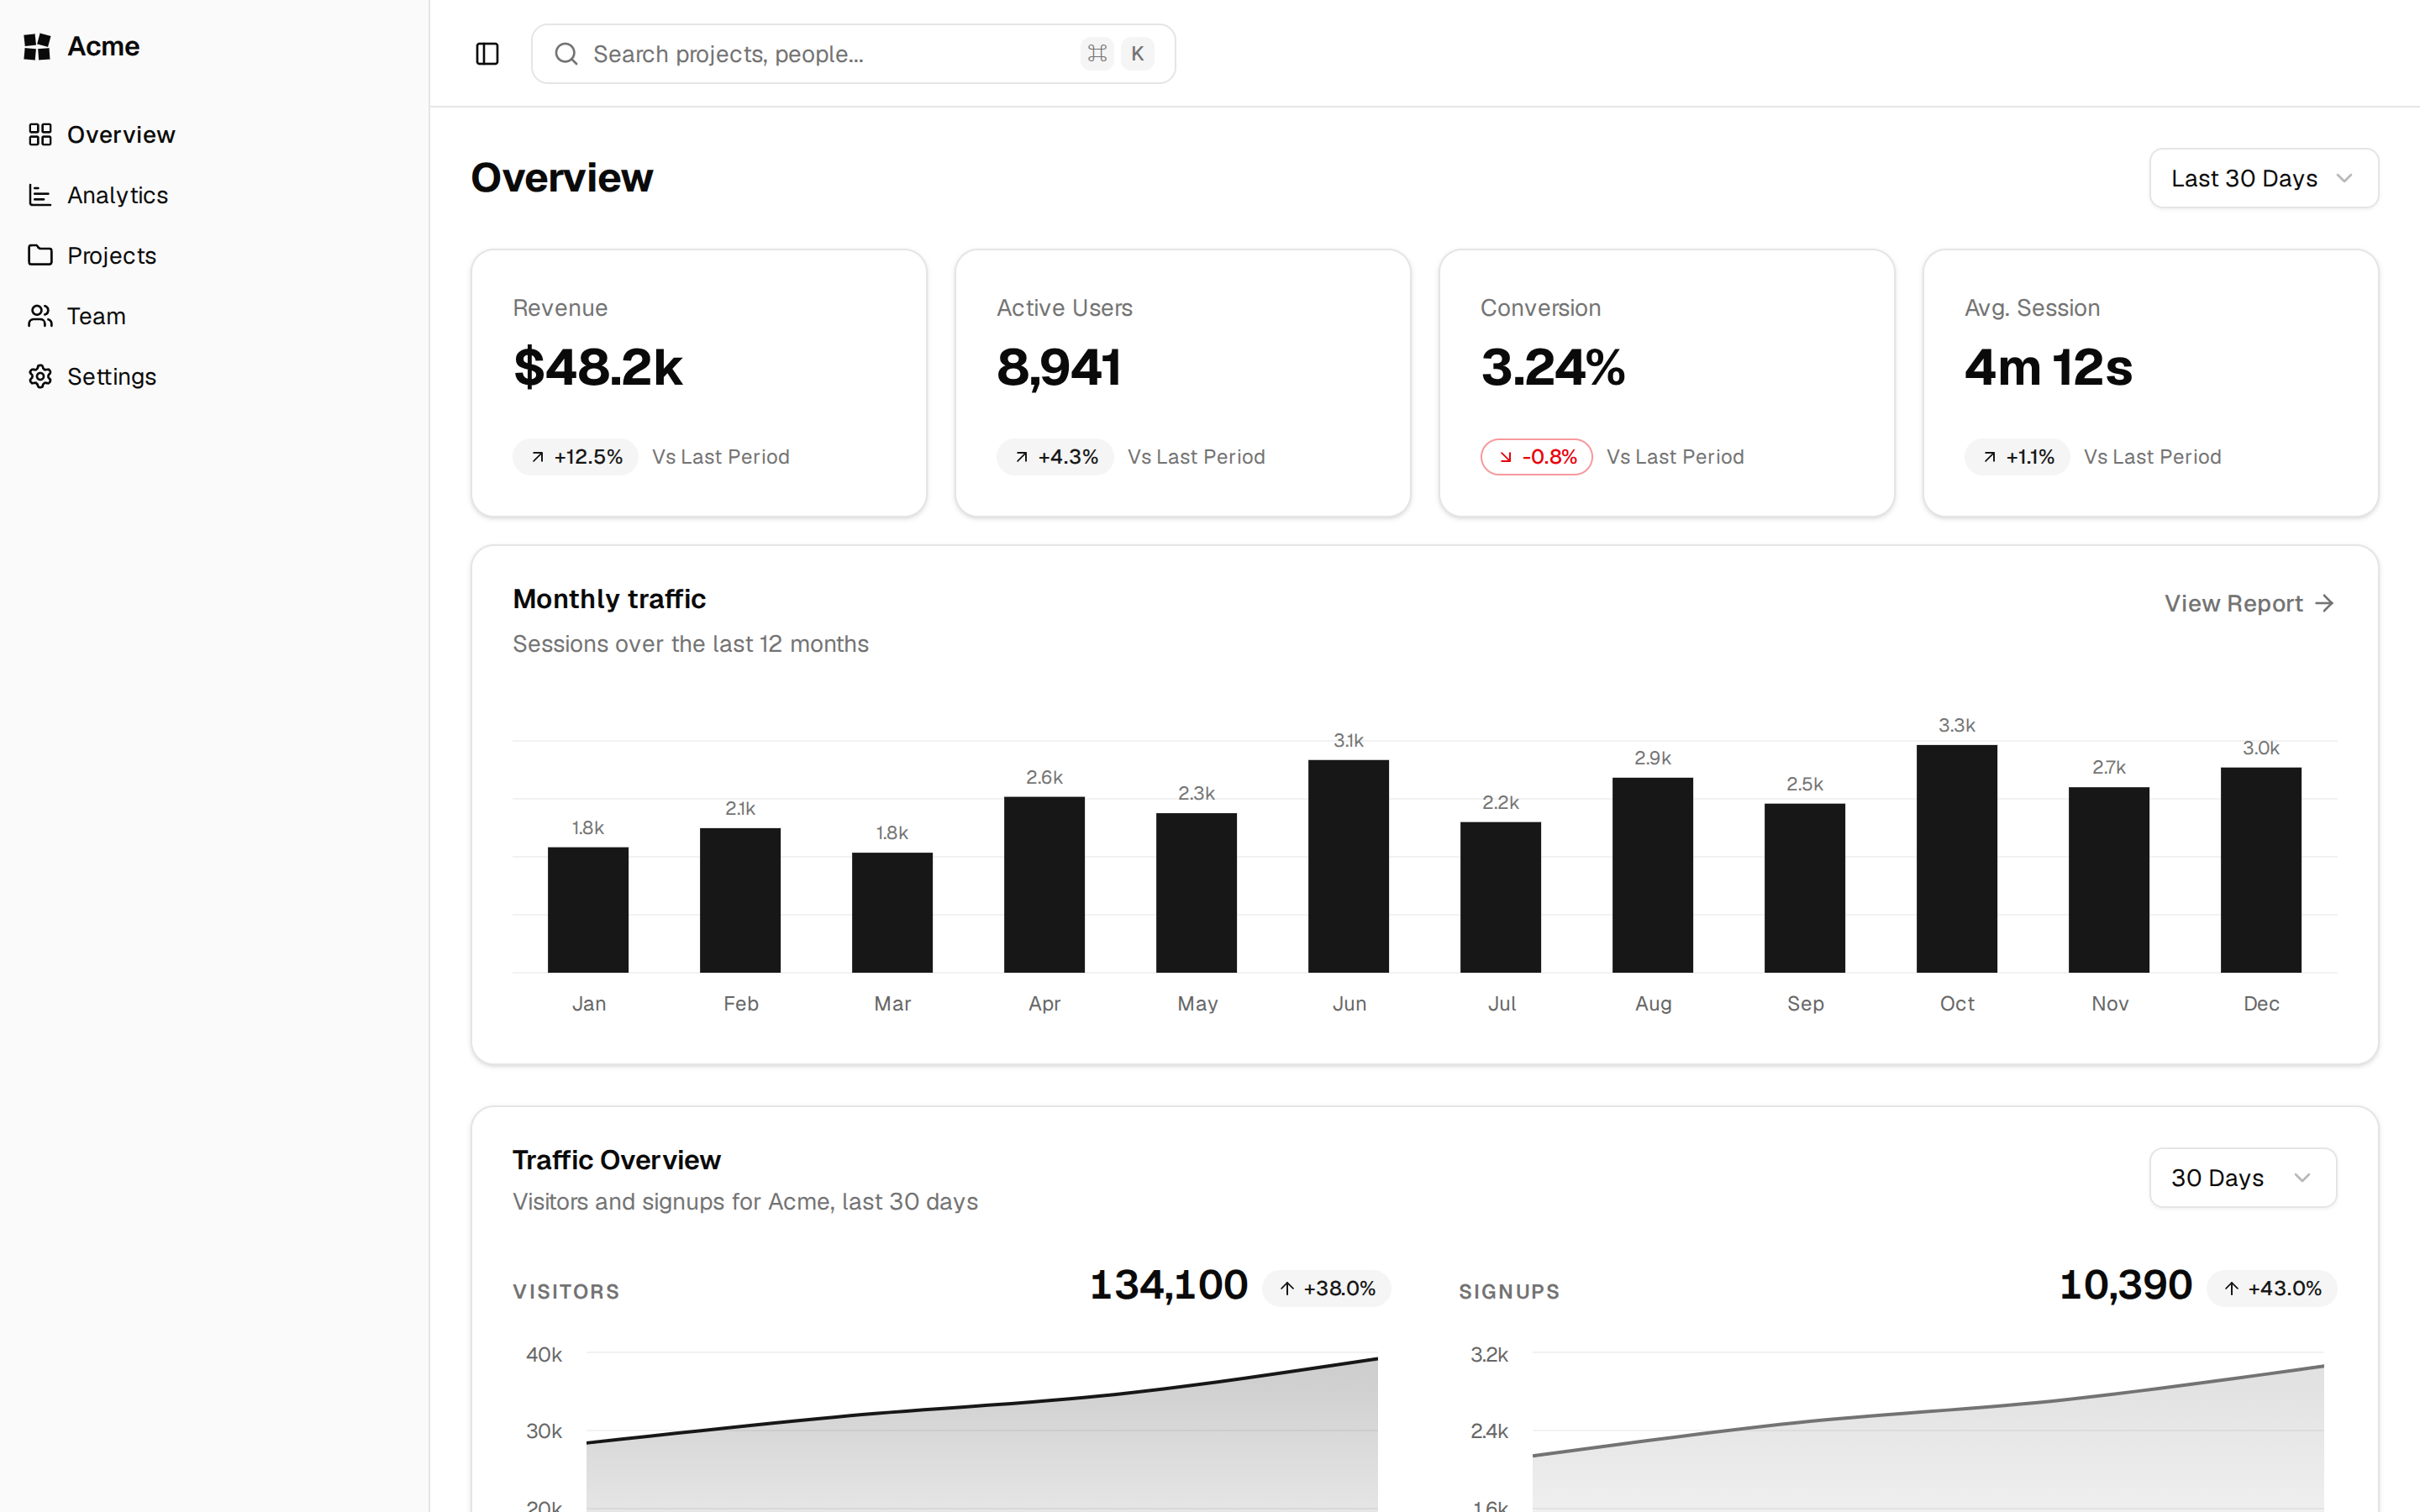
A stock price chart with time-range toggles, a scrubbing cursor that updates the header, and animated transitions between ranges.
@esuiss
A stock price chart with time-range toggles, a scrubbing cursor that updates the header, and animated transitions between ranges.
@esuiss
bases/radix/components/charts/area-chart-interactive.tsx
"use client"

import * as React from "react"
import {
  Area,
  AreaChart,
  CartesianGrid,
  ReferenceLine,
  useActiveTooltipDataPoints,
  XAxis,
  YAxis,
} from "recharts"

import { Card, CardContent, CardHeader } from "@/components/ui/card"
import {
  type ChartConfig,
  ChartContainer,
  ChartTooltip,
} from "@/components/ui/chart"
import { ToggleGroup, ToggleGroupItem } from "@/components/ui/toggle-group"

type Range = "1D" | "1W" | "1M" | "3M" | "1Y" | "5Y"

type Point = { index: number; price: number; label: string; tick: string }

const RANGES: Record<
  Range,
  {
    points: number
    seed: number
    volatility: number
    drift: number
    caption: string
  }
> = {
  "1D": {
    points: 78,
    seed: 11,
    volatility: 0.0025,
    drift: 0.46,
    caption: "Today",
  },
  "1W": {
    points: 35,
    seed: 23,
    volatility: 0.004,
    drift: 0.46,
    caption: "Past week",
  },
  "1M": {
    points: 22,
    seed: 37,
    volatility: 0.012,
    drift: 0.53,
    caption: "Past month",
  },
  "3M": {
    points: 64,
    seed: 41,
    volatility: 0.014,
    drift: 0.46,
    caption: "Past 3 months",
  },
  "1Y": {
    points: 52,
    seed: 59,
    volatility: 0.03,
    drift: 0.46,
    caption: "Past year",
  },
  "5Y": {
    points: 60,
    seed: 73,
    volatility: 0.045,
    drift: 0.46,
    caption: "Past 5 years",
  },
}

const LAST_PRICE = 254.32
const END = new Date(2026, 9, 6)
const SAMPLES = 80
const MORPH_DURATION = 520

const priceFormat = new Intl.NumberFormat("en-US", {
  minimumFractionDigits: 2,
  maximumFractionDigits: 2,
})
const changeFormat = new Intl.NumberFormat("en-US", {
  minimumFractionDigits: 2,
  maximumFractionDigits: 2,
  signDisplay: "always",
})
const dayFormat = new Intl.DateTimeFormat("en-US", {
  month: "short",
  day: "numeric",
})
const weekdayFormat = new Intl.DateTimeFormat("en-US", { weekday: "short" })
const monthFormat = new Intl.DateTimeFormat("en-US", { month: "short" })
const monthYearFormat = new Intl.DateTimeFormat("en-US", {
  month: "long",
  year: "numeric",
})

function businessDays(count: number) {
  const days: Date[] = []
  const day = new Date(END)
  while (days.length < count) {
    if (day.getDay() % 6) days.unshift(new Date(day))
    day.setDate(day.getDate() - 1)
  }
  return days
}

function generate(range: Range): Point[] {
  const { points, seed, volatility, drift } = RANGES[range]
  let state = seed
  let value = 100
  const values = Array.from({ length: points }, () => {
    state = (state * 16807) % 2147483647
    value *= 1 + ((state - 1) / 2147483646 - drift) * volatility
    return value
  })
  const last = values.at(-1)
  if (last === undefined) return []
  const scale = LAST_PRICE / last
  const days = businessDays(points)
  const week = businessDays(5)

  return values.map((raw, index) => {
    const price = Number((raw * scale).toFixed(2))
    if (range === "1D") {
      const minutes = 570 + index * 5
      const hour = Math.floor(minutes / 60)
      const minute = minutes % 60
      const time = `${hour}:${String(minute).padStart(2, "0")}`
      return {
        index,
        price,
        label: time,
        tick: minute === 0 ? `${hour}:00` : "",
      }
    }
    if (range === "1W") {
      const day = week[Math.floor(index / 7)]
      const weekday = weekdayFormat.format(day)
      return {
        index,
        price,
        label: `${weekday} ${10 + (index % 7)}:00`,
        tick: index % 7 === 0 ? weekday : "",
      }
    }
    if (range === "1M" || range === "3M") {
      const label = dayFormat.format(days[index])
      return { index, price, label, tick: label }
    }
    if (range === "1Y") {
      const day = new Date(END)
      day.setDate(day.getDate() - (points - 1 - index) * 7)
      return {
        index,
        price,
        label: `${dayFormat.format(day)}, ${day.getFullYear()}`,
        tick: monthFormat.format(day),
      }
    }
    const month = new Date(
      END.getFullYear(),
      END.getMonth() - (points - 1 - index),
      1
    )
    return {
      index,
      price,
      label: monthYearFormat.format(month),
      tick: String(month.getFullYear()),
    }
  })
}

function resample(source: Point[]) {
  const samples: Point[] = []
  let previous = -1
  for (let index = 0; index < SAMPLES; index++) {
    const position = (index * (source.length - 1)) / (SAMPLES - 1)
    const from = Math.floor(position)
    const to = Math.min(source.length - 1, from + 1)
    const nearest = Math.round(position)
    const start = source[from]
    const end = source[to]
    const closest = source[nearest]
    if (!start || !end || !closest) return samples
    const price = start.price + (end.price - start.price) * (position - from)
    samples.push({
      index,
      price: Number(price.toFixed(2)),
      label: closest.label,
      tick: nearest !== previous ? closest.tick : "",
    })
    previous = nearest
  }
  return samples
}

function tickIndexes(points: Point[], max: number) {
  const ticks = points
    .filter(
      (point, index) => point.tick && point.tick !== points[index - 1]?.tick
    )
    .map((point) => point.index)
  if (ticks.length <= max) return ticks
  const step = Math.ceil(ticks.length / max)
  return ticks.filter((_, index) => index % step === 0)
}

function useMorph(target: number[]) {
  const [values, setValues] = React.useState(target)
  const valuesRef = React.useRef(values)

  React.useEffect(() => {
    const from = valuesRef.current
    if (
      target.length === from.length &&
      target.every((value, index) => value === from[index])
    )
      return
    const reduced = window.matchMedia(
      "(prefers-reduced-motion: reduce)"
    ).matches
    const start = performance.now()
    let frame = 0
    const step = () => {
      const progress = reduced
        ? 1
        : Math.min(1, (performance.now() - start) / MORPH_DURATION)
      const eased = 1 - (1 - progress) ** 3
      const next =
        progress < 1
          ? target.map((value, index) => {
              const origin = from[index] ?? value
              return origin + (value - origin) * eased
            })
          : target
      valuesRef.current = next
      setValues(next)
      if (progress < 1) frame = requestAnimationFrame(step)
    }
    frame = requestAnimationFrame(step)
    return () => cancelAnimationFrame(frame)
  }, [target])

  return values
}

function ActivePoint({
  onChange,
}: {
  onChange: (index: number | null) => void
}) {
  const points = useActiveTooltipDataPoints<Point>()
  const index = points?.[0]?.index ?? null

  React.useEffect(() => onChange(index), [index, onChange])

  return null
}

export function AreaChartInteractive() {
  const id = React.useId()
  const [range, setRange] = React.useState<Range>("1M")
  const [hovered, setHovered] = React.useState<number | null>(null)
  const [released, setReleased] = React.useState(false)
  const active = released ? null : hovered
  const points = React.useMemo(() => resample(generate(range)), [range])
  const target = React.useMemo(
    () => points.map((point) => point.price),
    [points]
  )
  const animated = useMorph(target)
  const data = points.map((point, index) => ({
    ...point,
    price: animated[index],
  }))

  const opening = points[0]
  const current = points[active ?? points.length - 1]
  const baseline = data[0]
  if (!opening || !current || !baseline) return null

  const first = opening.price
  const change = current.price - first
  const rising = change >= 0
  const prices = points.map((point) => point.price)
  const shown = animated
  const min = Math.min(...shown)
  const max = Math.max(...shown)
  const padding = (max - min) * 0.12
  const chartConfig = {
    price: {
      label: "Price",
      color: rising ? "var(--color-green-500)" : "var(--destructive)",
    },
  } satisfies ChartConfig

  const stats = [
    ["Open", priceFormat.format(first)],
    ["High", priceFormat.format(Math.max(...prices))],
    ["Low", priceFormat.format(Math.min(...prices))],
    ["Volume", range === "1D" ? "41.2M" : "1.24B"],
  ]

  return (
    <Card variant="filled" size="sm" className="[--card-spacing:--spacing(5)]">
      <CardHeader className="flex flex-wrap items-start justify-between gap-4">
        <div className="flex min-w-56 flex-1 flex-col gap-0.5">
          <p className="flex items-baseline gap-2">
            <span className="text-2xl font-semibold tracking-tight">ACME</span>
            <span className="text-base text-muted-foreground">Acme Corp.</span>
          </p>
          <p className="flex flex-wrap items-baseline gap-2.5">
            <span className="text-3xl font-semibold tracking-tight tabular-nums">
              ${priceFormat.format(current.price)}
            </span>
            <span
              data-trend={rising ? "up" : "down"}
              className="text-base font-semibold tabular-nums data-[trend=down]:text-destructive data-[trend=up]:text-green-600 dark:data-[trend=up]:text-green-400"
            >
              {changeFormat.format(change)} (
              {priceFormat.format(Math.abs((change / first) * 100))}%)
            </span>
          </p>
          <p className="min-h-5 text-sm text-muted-foreground">
            {active === null ? RANGES[range].caption : current.label}
          </p>
        </div>
        <ToggleGroup
          spacing={0}
          type="single"
          value={range}
          onValueChange={(value: string) => {
            if (value) setRange(value as Range)
          }}
          aria-label="Time range"
        >
          {(Object.keys(RANGES) as Range[]).map((key) => (
            <ToggleGroupItem key={key} value={key} size="sm">
              {key}
            </ToggleGroupItem>
          ))}
        </ToggleGroup>
      </CardHeader>
      <CardContent className="flex flex-col gap-4">
        <ChartContainer
          config={chartConfig}
          onPointerDownCapture={() => setReleased(false)}
          onPointerUpCapture={(event) => {
            if (event.pointerType !== "mouse") setReleased(true)
          }}
          onPointerCancelCapture={() => setReleased(true)}
          onPointerMoveCapture={(event) => {
            if (event.pointerType === "mouse") setReleased(false)
          }}
          onKeyDownCapture={() => setReleased(false)}
          className="aspect-auto h-72 w-full touch-pan-y [&_.recharts-area-area]:transition-[fill] [&_.recharts-area-curve]:transition-[stroke] [&_.recharts-area-curve]:duration-500 [&_stop]:transition-[stop-color] [&_stop]:duration-500"
        >
          <AreaChart
            accessibilityLayer
            data={data}
            margin={{ top: 10, right: 0, left: 0, bottom: 0 }}
          >
            <defs>
              <linearGradient id={id} x1="0" y1="0" x2="0" y2="1">
                <stop
                  offset="0%"
                  stopColor="var(--color-price)"
                  stopOpacity={0.3}
                />
                <stop
                  offset="100%"
                  stopColor="var(--color-price)"
                  stopOpacity={0.02}
                />
              </linearGradient>
            </defs>
            <CartesianGrid vertical={false} strokeDasharray="2 4" />
            <XAxis
              dataKey="index"
              type="number"
              domain={["dataMin", "dataMax"]}
              ticks={tickIndexes(points, 6)}
              tickFormatter={(index: number) => points[index]?.tick ?? ""}
              tickLine={false}
              axisLine={false}
              tickMargin={8}
              minTickGap={4}
            />
            <YAxis
              orientation="right"
              domain={[min - padding, max + padding]}
              tickFormatter={(value: number) => Math.round(value).toString()}
              tickLine={false}
              axisLine={false}
              tickMargin={6}
              tickCount={5}
              width={40}
            />
            <ReferenceLine
              y={baseline.price}
              stroke="var(--muted-foreground)"
              strokeDasharray="2 3"
            />
            <ChartTooltip
              active={released ? false : undefined}
              cursor={
                released
                  ? false
                  : { stroke: "var(--muted-foreground)", strokeWidth: 1 }
              }
              content={() => null}
            />
            <Area
              dataKey="price"
              type="linear"
              stroke="var(--color-price)"
              strokeWidth={2}
              fill={`url(#${id})`}
              isAnimationActive={false}
              activeDot={
                released
                  ? false
                  : {
                      r: 5,
                      fill: "var(--color-price)",
                      stroke: "var(--muted)",
                      strokeWidth: 2,
                    }
              }
            />
            <ActivePoint onChange={setHovered} />
          </AreaChart>
        </ChartContainer>
        <dl className="grid grid-cols-[repeat(auto-fit,minmax(9rem,1fr))] gap-x-6">
          {stats.map(([term, value]) => (
            <div
              key={term}
              className="flex items-center gap-2 border-b border-border py-1.75 text-sm"
            >
              <dt className="flex-1 text-muted-foreground">{term}</dt>
              <dd className="font-semibold tabular-nums">{value}</dd>
            </div>
          ))}
        </dl>
      </CardContent>
    </Card>
  )
}