Area Chart Sparkline
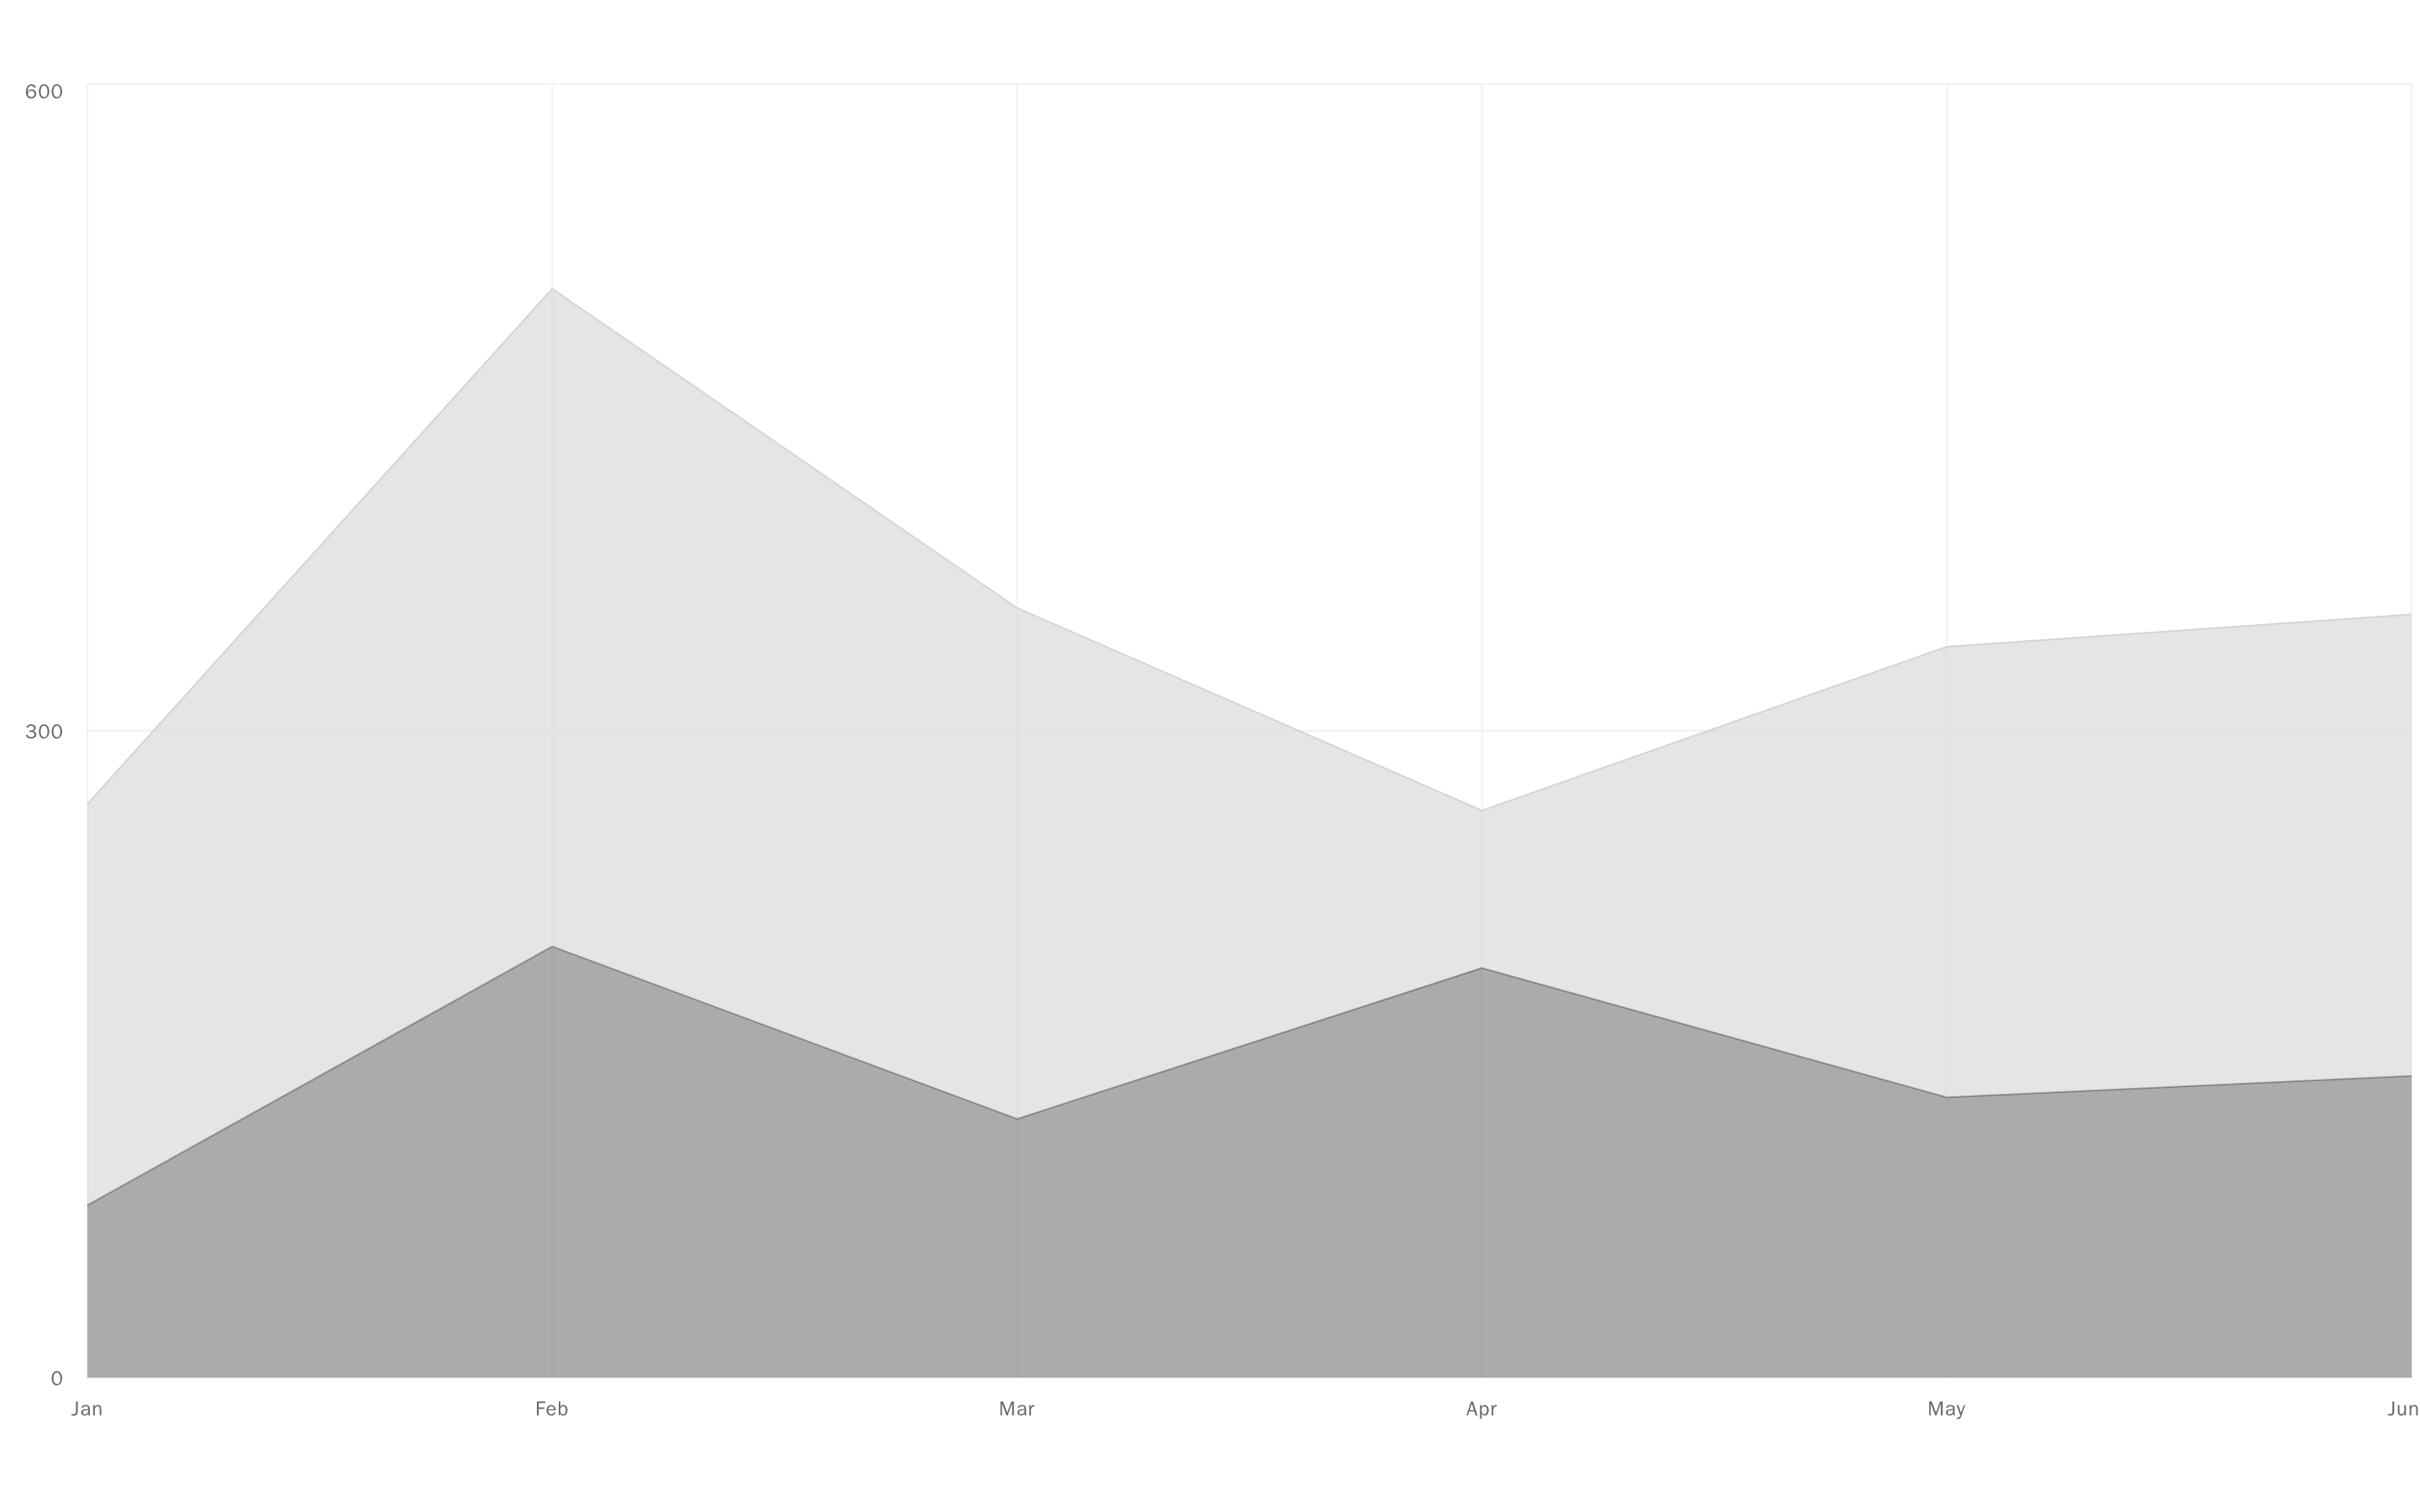
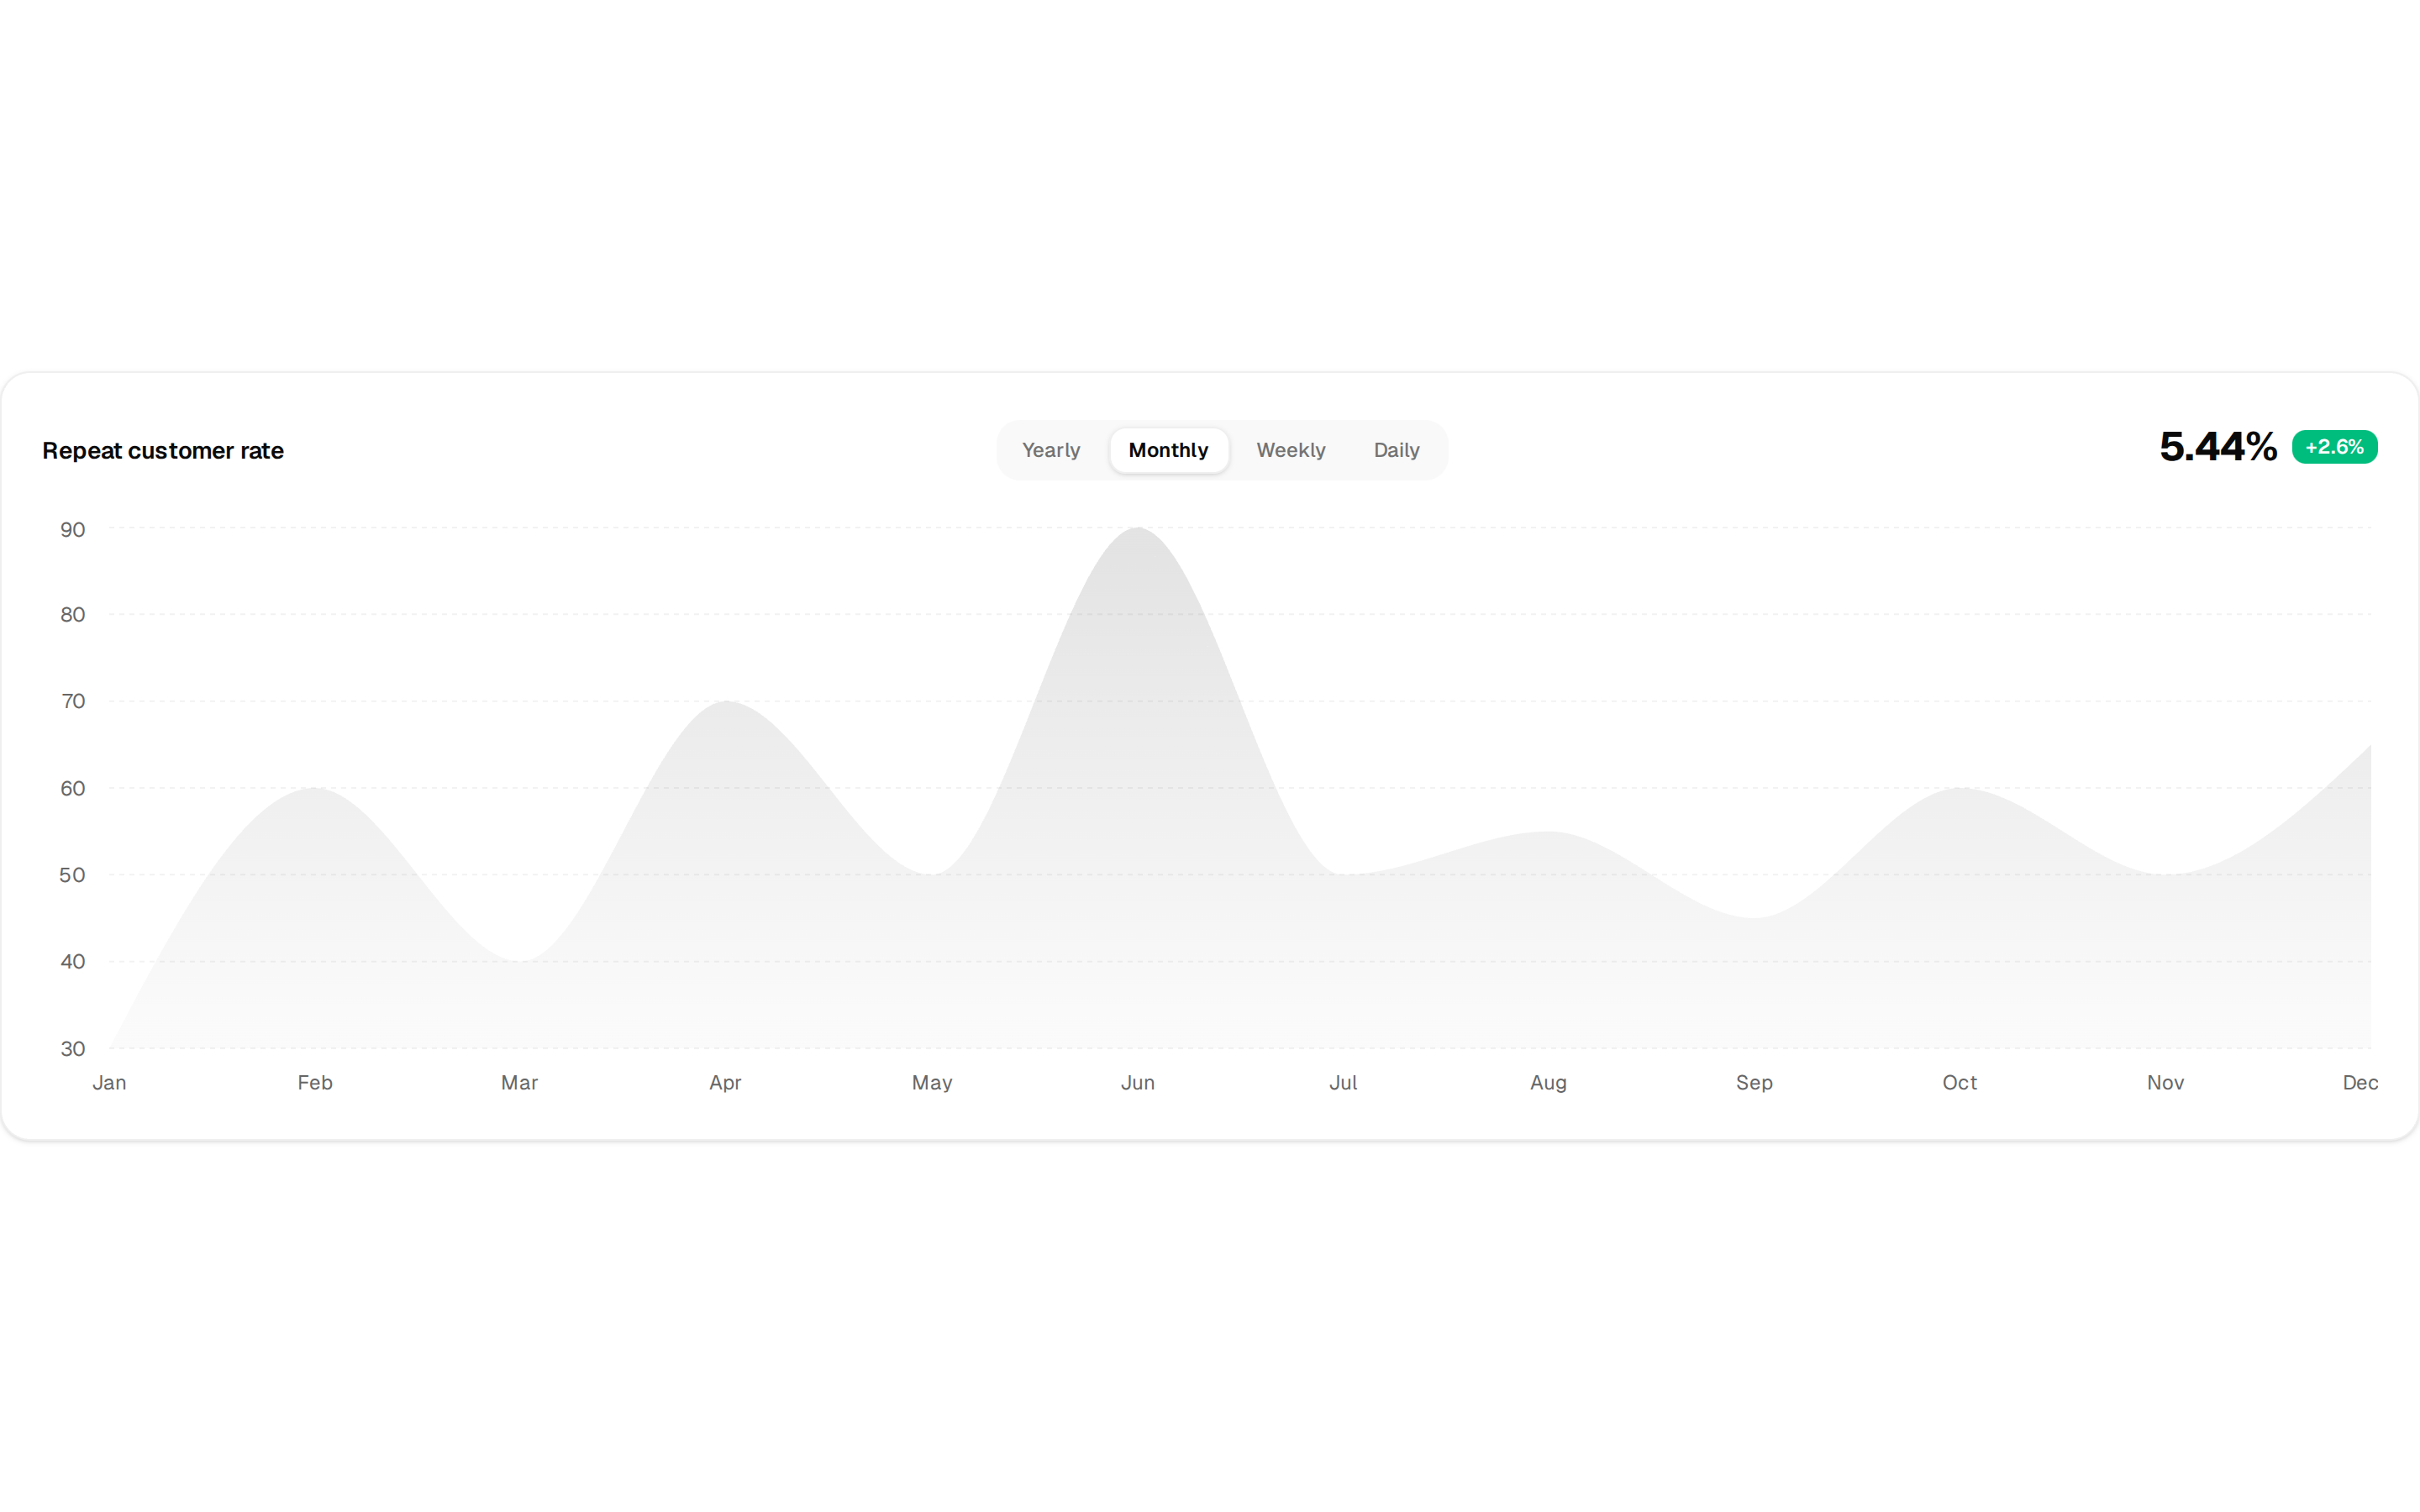
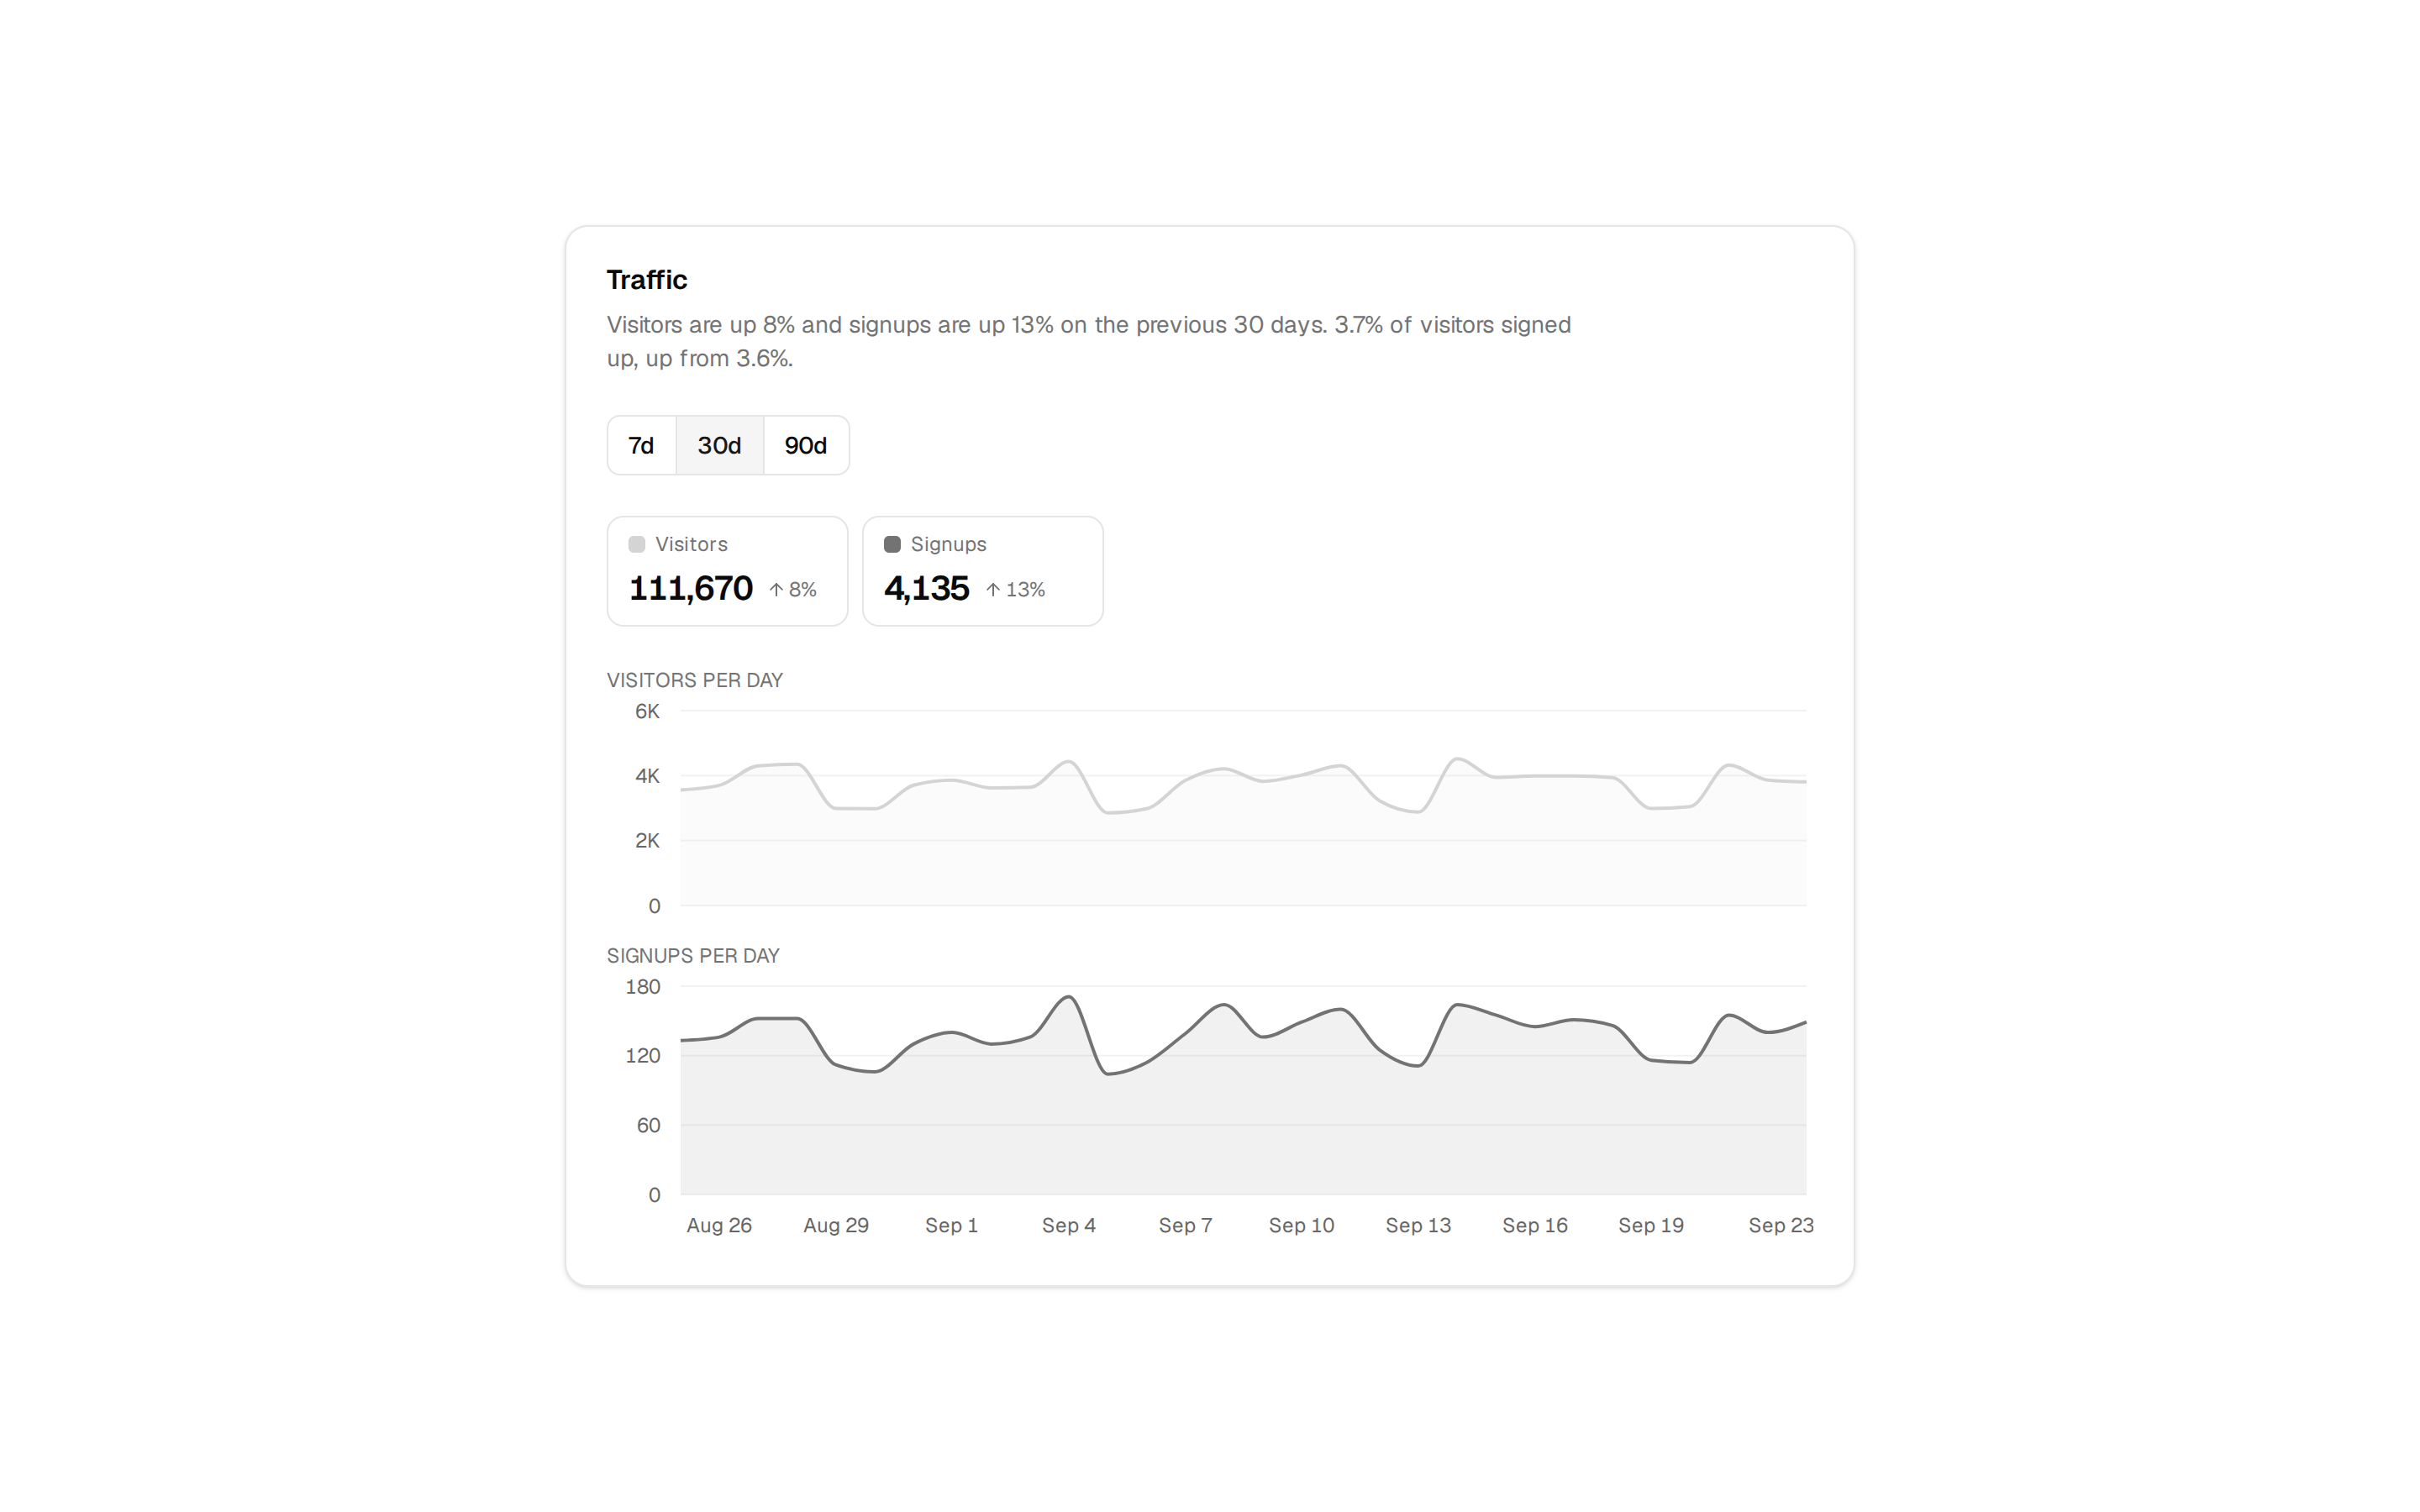
A watchlist with a tiny gradient area chart beside each price, colored by whether the stock is rising or falling.
@esuiss
A watchlist with a tiny gradient area chart beside each price, colored by whether the stock is rising or falling.
@esuiss
components/charts/area-chart-sparkline.tsx
"use client"

import * as React from "react"
import { Area, AreaChart, YAxis } from "recharts"

import {
  Card,
  CardContent,
  CardDescription,
  CardHeader,
  CardTitle,
} from "@/components/ui/card"
import { type ChartConfig, ChartContainer } from "@/components/ui/chart"

const stocks = [
  { symbol: "ACME", name: "Acme Corp.", price: 254.32, change: 1.28, seed: 41 },
  { symbol: "GLBX", name: "Globex", price: 512.08, change: -0.64, seed: 52 },
  { symbol: "INIT", name: "Initech", price: 186.4, change: 2.91, seed: 63 },
  { symbol: "UMBR", name: "Umbrella", price: 438.15, change: -1.87, seed: 74 },
]

const chartConfig = {
  up: { label: "Rising", color: "var(--color-green-500)" },
  down: { label: "Falling", color: "var(--destructive)" },
} satisfies ChartConfig

const priceFormat = new Intl.NumberFormat("en-US", {
  minimumFractionDigits: 2,
  maximumFractionDigits: 2,
})

const changeFormat = new Intl.NumberFormat("en-US", {
  minimumFractionDigits: 2,
  maximumFractionDigits: 2,
  signDisplay: "always",
})

function series(seed: number, rising: boolean) {
  let state = seed
  let value = 100
  return Array.from({ length: 30 }, (_, index) => {
    state = (state * 16807) % 2147483647
    value *= 1 + ((state - 1) / 2147483646 - (rising ? 0.44 : 0.56)) * 0.02
    return { index, value }
  })
}

function Sparkline({ seed, rising }: { seed: number; rising: boolean }) {
  const key = rising ? "up" : "down"
  const id = React.useId()

  return (
    <ChartContainer
      config={chartConfig}
      aria-hidden
      className="aspect-auto h-8 w-18 shrink-0"
    >
      <AreaChart
        accessibilityLayer={false}
        data={series(seed, rising)}
        margin={{ top: 2, right: 0, left: 0, bottom: 2 }}
      >
        <defs>
          <linearGradient id={id} x1="0" y1="0" x2="0" y2="1">
            <stop
              offset="0%"
              stopColor={`var(--color-${key})`}
              stopOpacity={0.25}
            />
            <stop
              offset="100%"
              stopColor={`var(--color-${key})`}
              stopOpacity={0.02}
            />
          </linearGradient>
        </defs>
        <YAxis hide domain={["dataMin", "dataMax"]} />
        <Area
          dataKey="value"
          type="linear"
          stroke={`var(--color-${key})`}
          strokeWidth={1.5}
          fill={`url(#${id})`}
          isAnimationActive={false}
          dot={false}
        />
      </AreaChart>
    </ChartContainer>
  )
}

export function AreaChartSparkline() {
  return (
    <Card variant="filled" size="sm">
      <CardHeader>
        <CardTitle>Watchlist</CardTitle>
        <CardDescription>Small area charts next to each price</CardDescription>
      </CardHeader>
      <CardContent>
        <ul className="flex flex-col">
          {stocks.map((stock) => {
            const rising = stock.change >= 0

            return (
              <li
                key={stock.symbol}
                className="flex items-center gap-3 border-border py-2.25 not-first:border-t"
              >
                <span className="flex min-w-0 flex-1 flex-col">
                  <span className="text-base font-semibold">
                    {stock.symbol}
                  </span>
                  <span className="truncate text-xs text-muted-foreground">
                    {stock.name}
                  </span>
                </span>
                <Sparkline seed={stock.seed} rising={rising} />
                <span className="flex flex-col items-end gap-0.75">
                  <span className="text-sm font-semibold tabular-nums">
                    {priceFormat.format(stock.price)}
                  </span>
                  <span
                    data-trend={rising ? "up" : "down"}
                    className="min-w-13 rounded-md px-1.5 py-0.5 text-end text-xs font-semibold text-primary-foreground tabular-nums data-[trend=down]:bg-destructive data-[trend=up]:bg-green-500 dark:text-background"
                  >
                    {changeFormat.format(stock.change)}%
                  </span>
                </span>
              </li>
            )
          })}
        </ul>
      </CardContent>
    </Card>
  )
}