Area Chart Range
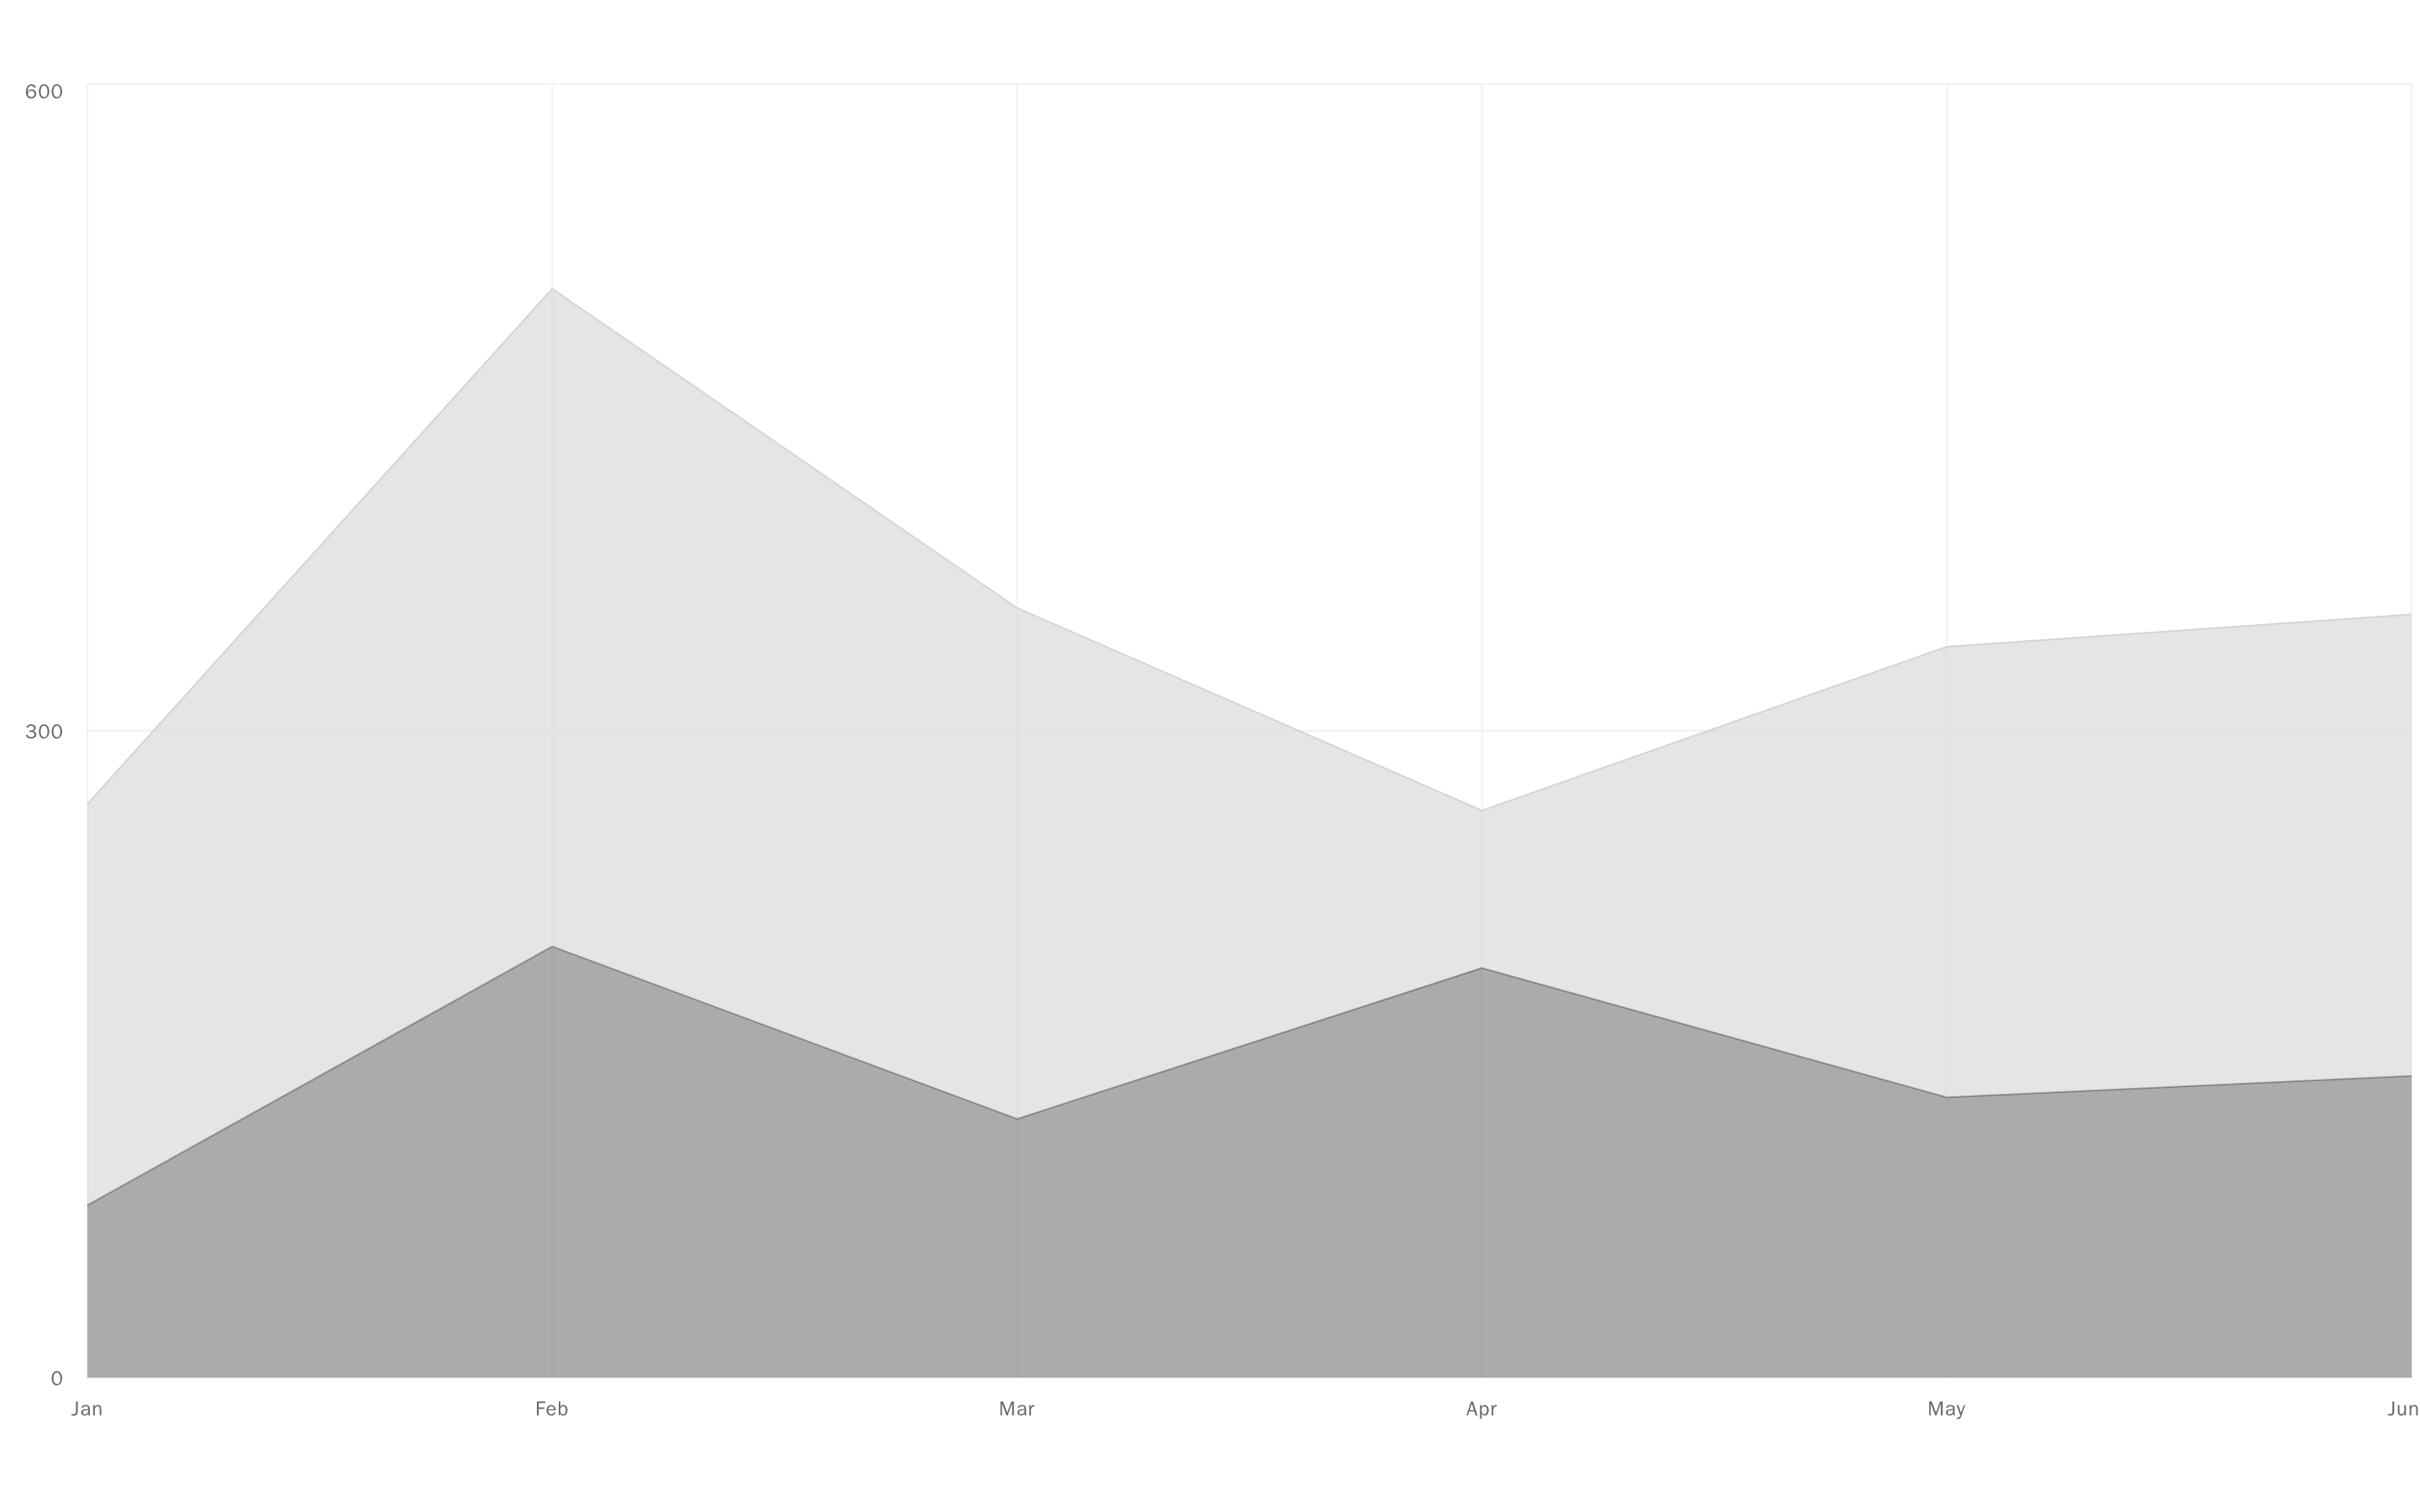
A heart-rate band showing each hour's low-to-high range as a shaded area with an average line through it.
@esuiss
A heart-rate band showing each hour's low-to-high range as a shaded area with an average line through it.
@esuiss
components/charts/area-chart-range.tsx
"use client"

import {
  Area,
  CartesianGrid,
  ComposedChart,
  Line,
  XAxis,
  YAxis,
} from "recharts"

import { Card, CardContent, CardHeader } from "@/components/ui/card"
import {
  type ChartConfig,
  ChartContainer,
  ChartTooltip,
  ChartTooltipContent,
} from "@/components/ui/chart"

const readings: [low: number, high: number, average: number][] = [
  [48, 62, 54],
  [46, 60, 52],
  [47, 64, 54],
  [45, 61, 52],
  [48, 63, 55],
  [46, 66, 54],
  [56, 78, 64],
  [58, 82, 66],
  [64, 88, 74],
  [66, 90, 76],
  [64, 92, 74],
  [66, 89, 75],
  [65, 94, 76],
  [66, 90, 75],
  [64, 88, 74],
  [65, 91, 76],
  [66, 92, 75],
  [68, 96, 78],
  [104, 158, 126],
  [102, 150, 122],
  [70, 94, 78],
  [66, 90, 74],
  [60, 82, 68],
  [52, 70, 58],
]

const chartData = readings.map(([low, high, average], hour) => ({
  hour: `${hour}:00`,
  range: [low, high] as const,
  average,
}))

const chartConfig = {
  range: { label: "Range", color: "var(--color-red-500)" },
  average: { label: "Average", color: "var(--color-red-500)" },
} satisfies ChartConfig

const low = Math.min(...chartData.map((point) => point.range[0]))
const high = Math.max(...chartData.map((point) => point.range[1]))

export function AreaChartRange() {
  return (
    <Card variant="filled" size="sm">
      <CardHeader className="gap-0.5">
        <p className="text-sm font-semibold text-destructive">Heart rate</p>
        <p className="flex items-baseline gap-1">
          <span className="text-3xl font-semibold tracking-tight tabular-nums">
            {low}–{high}
          </span>
          <span className="text-base font-semibold text-muted-foreground">
            BPM
          </span>
        </p>
        <p className="text-sm text-muted-foreground">Today</p>
      </CardHeader>
      <CardContent>
        <ChartContainer
          config={chartConfig}
          className="aspect-auto h-40 w-full"
        >
          <ComposedChart
            accessibilityLayer
            data={chartData}
            margin={{ top: 10, right: 4, left: 16, bottom: 0 }}
          >
            <CartesianGrid vertical={false} strokeDasharray="2 4" />
            <XAxis
              dataKey="hour"
              tickLine={false}
              axisLine={false}
              tickMargin={8}
              interval={5}
            />
            <YAxis
              orientation="right"
              tickLine={false}
              axisLine={false}
              tickMargin={6}
              width="auto"
              domain={[40, 170]}
              ticks={[50, 100, 150]}
            />
            <ChartTooltip
              content={
                <ChartTooltipContent
                  indicator="line"
                  formatter={(value, name) => (
                    <div className="flex w-full justify-between gap-3">
                      <span className="text-muted-foreground">
                        {chartConfig[name as keyof typeof chartConfig].label}
                      </span>
                      <span className="font-semibold tabular-nums">
                        {Array.isArray(value) ? value.join("–") : value} BPM
                      </span>
                    </div>
                  )}
                />
              }
            />
            <Area
              dataKey="range"
              type="monotone"
              stroke="none"
              fill="var(--color-range)"
              fillOpacity={0.22}
            />
            <Line
              dataKey="average"
              type="monotone"
              stroke="var(--color-average)"
              strokeWidth={2}
              dot={false}
            />
          </ComposedChart>
        </ChartContainer>
      </CardContent>
    </Card>
  )
}