Tooltip Chart Label Formatter
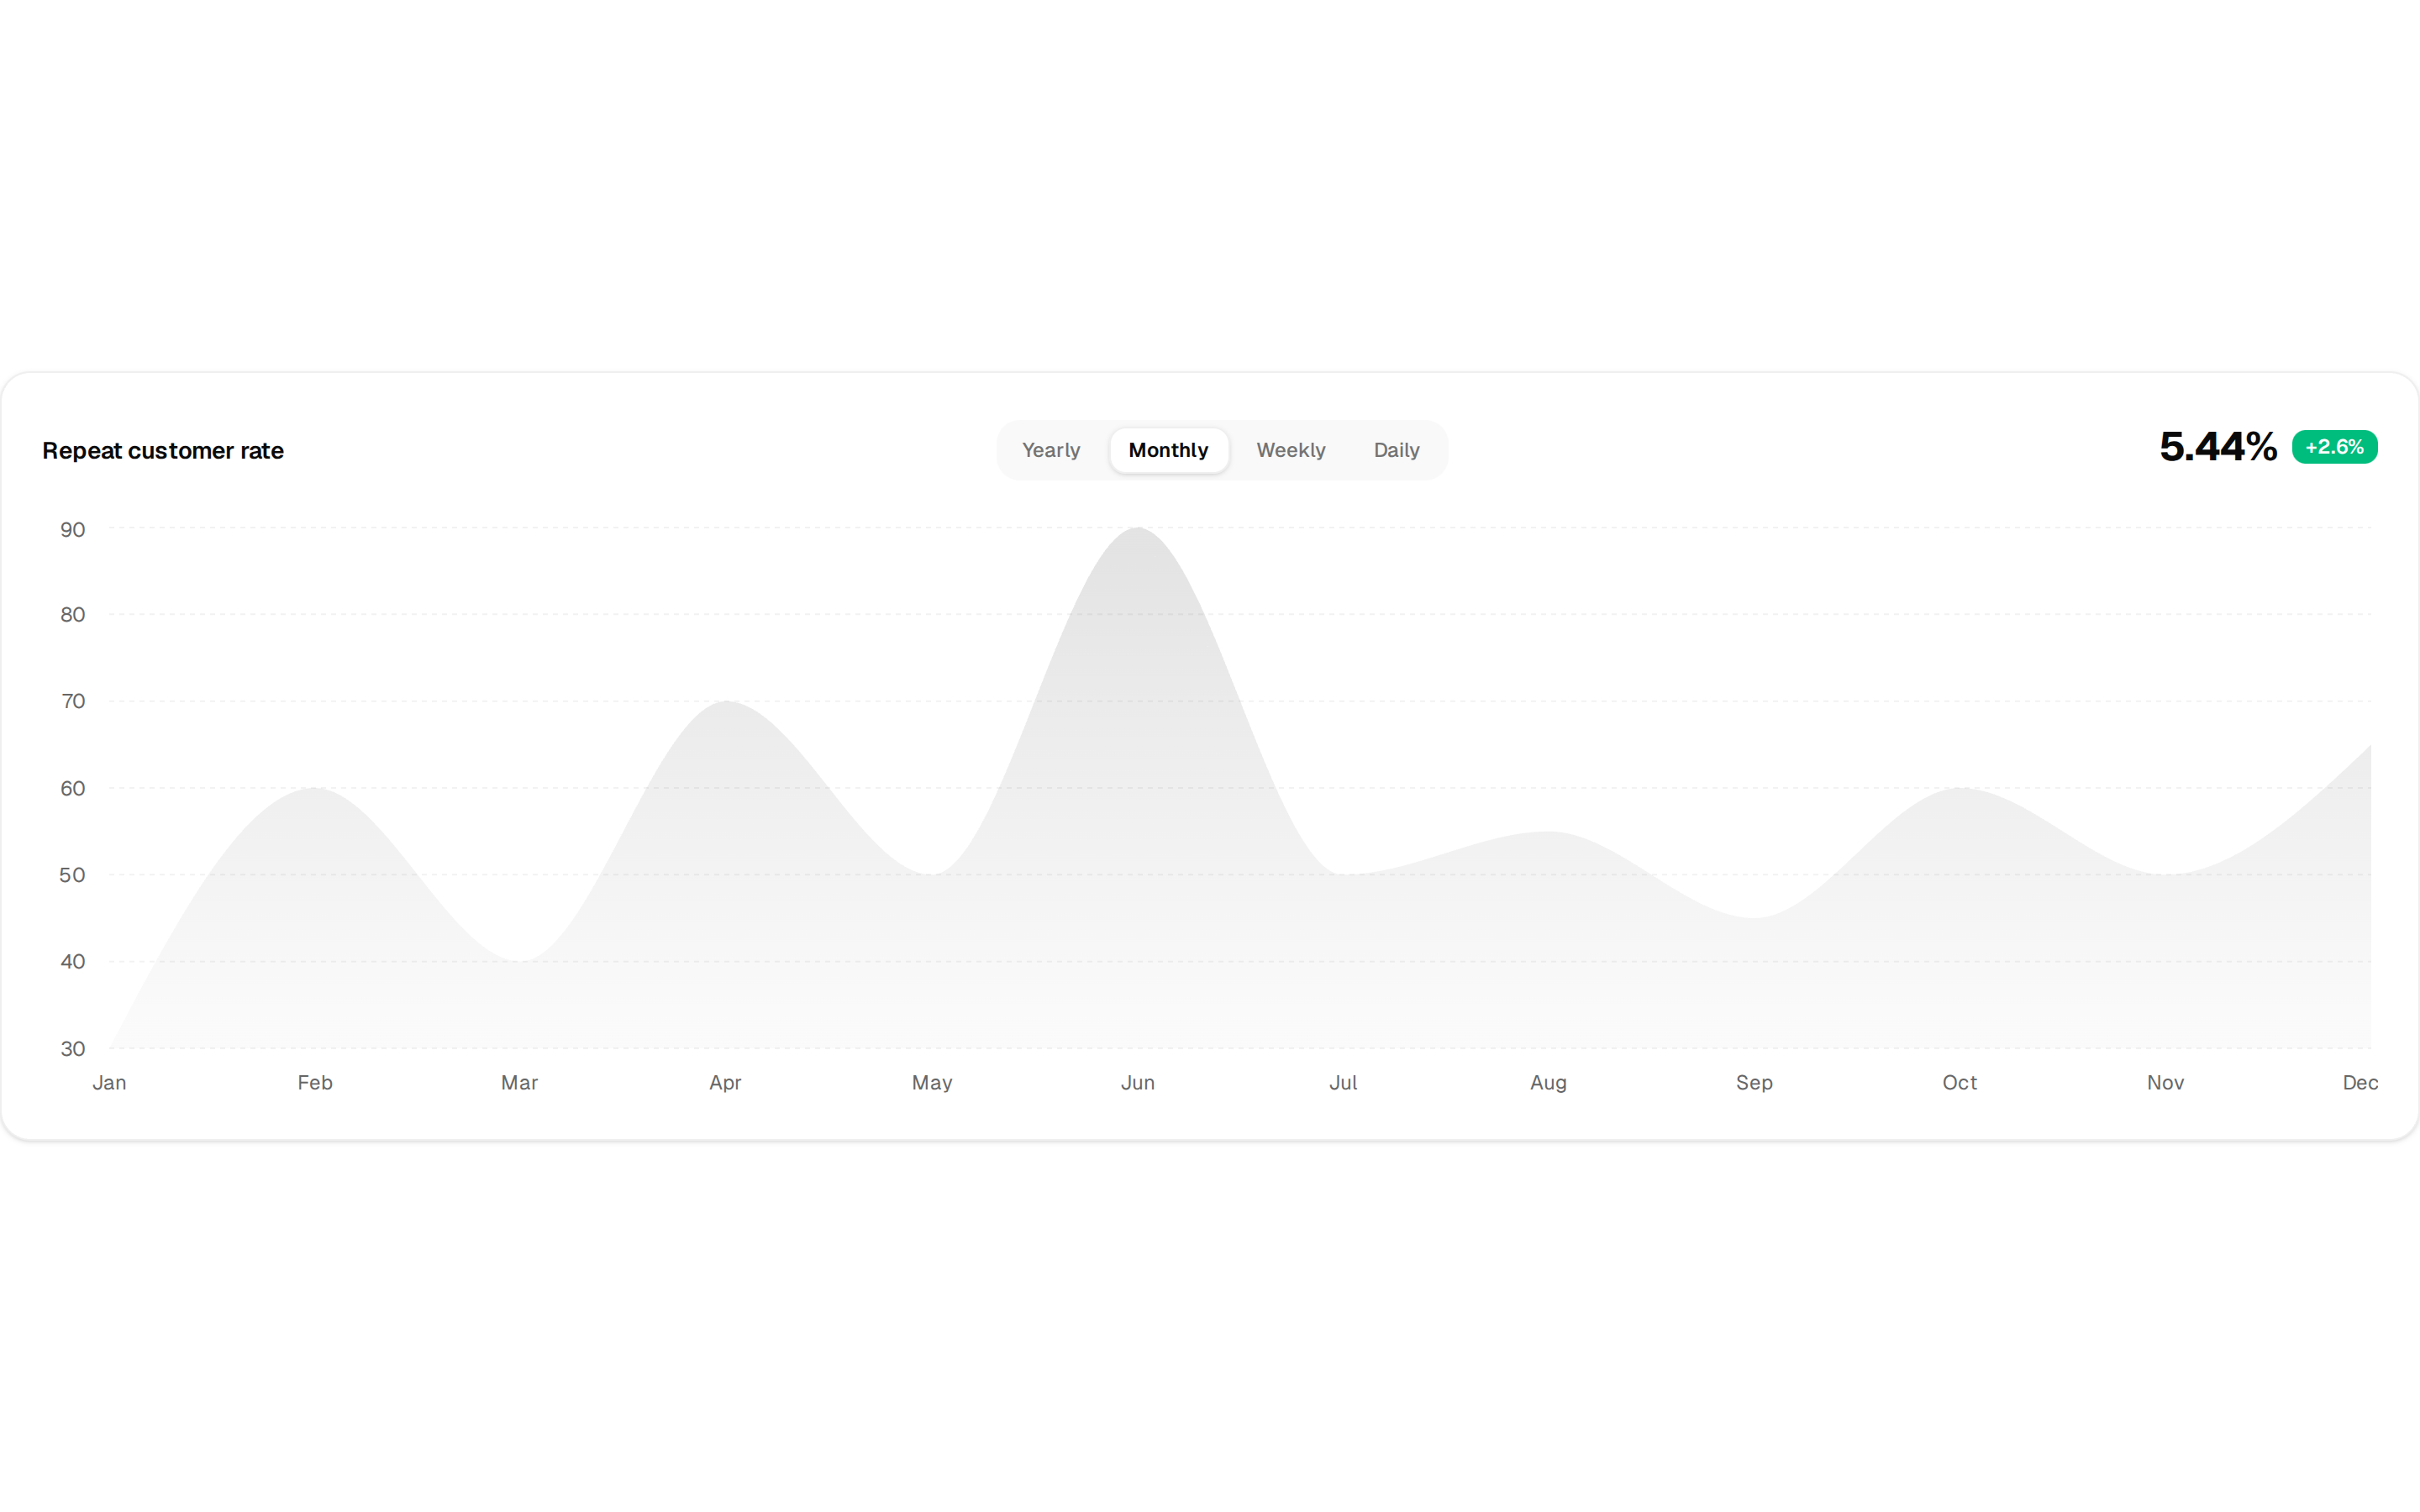
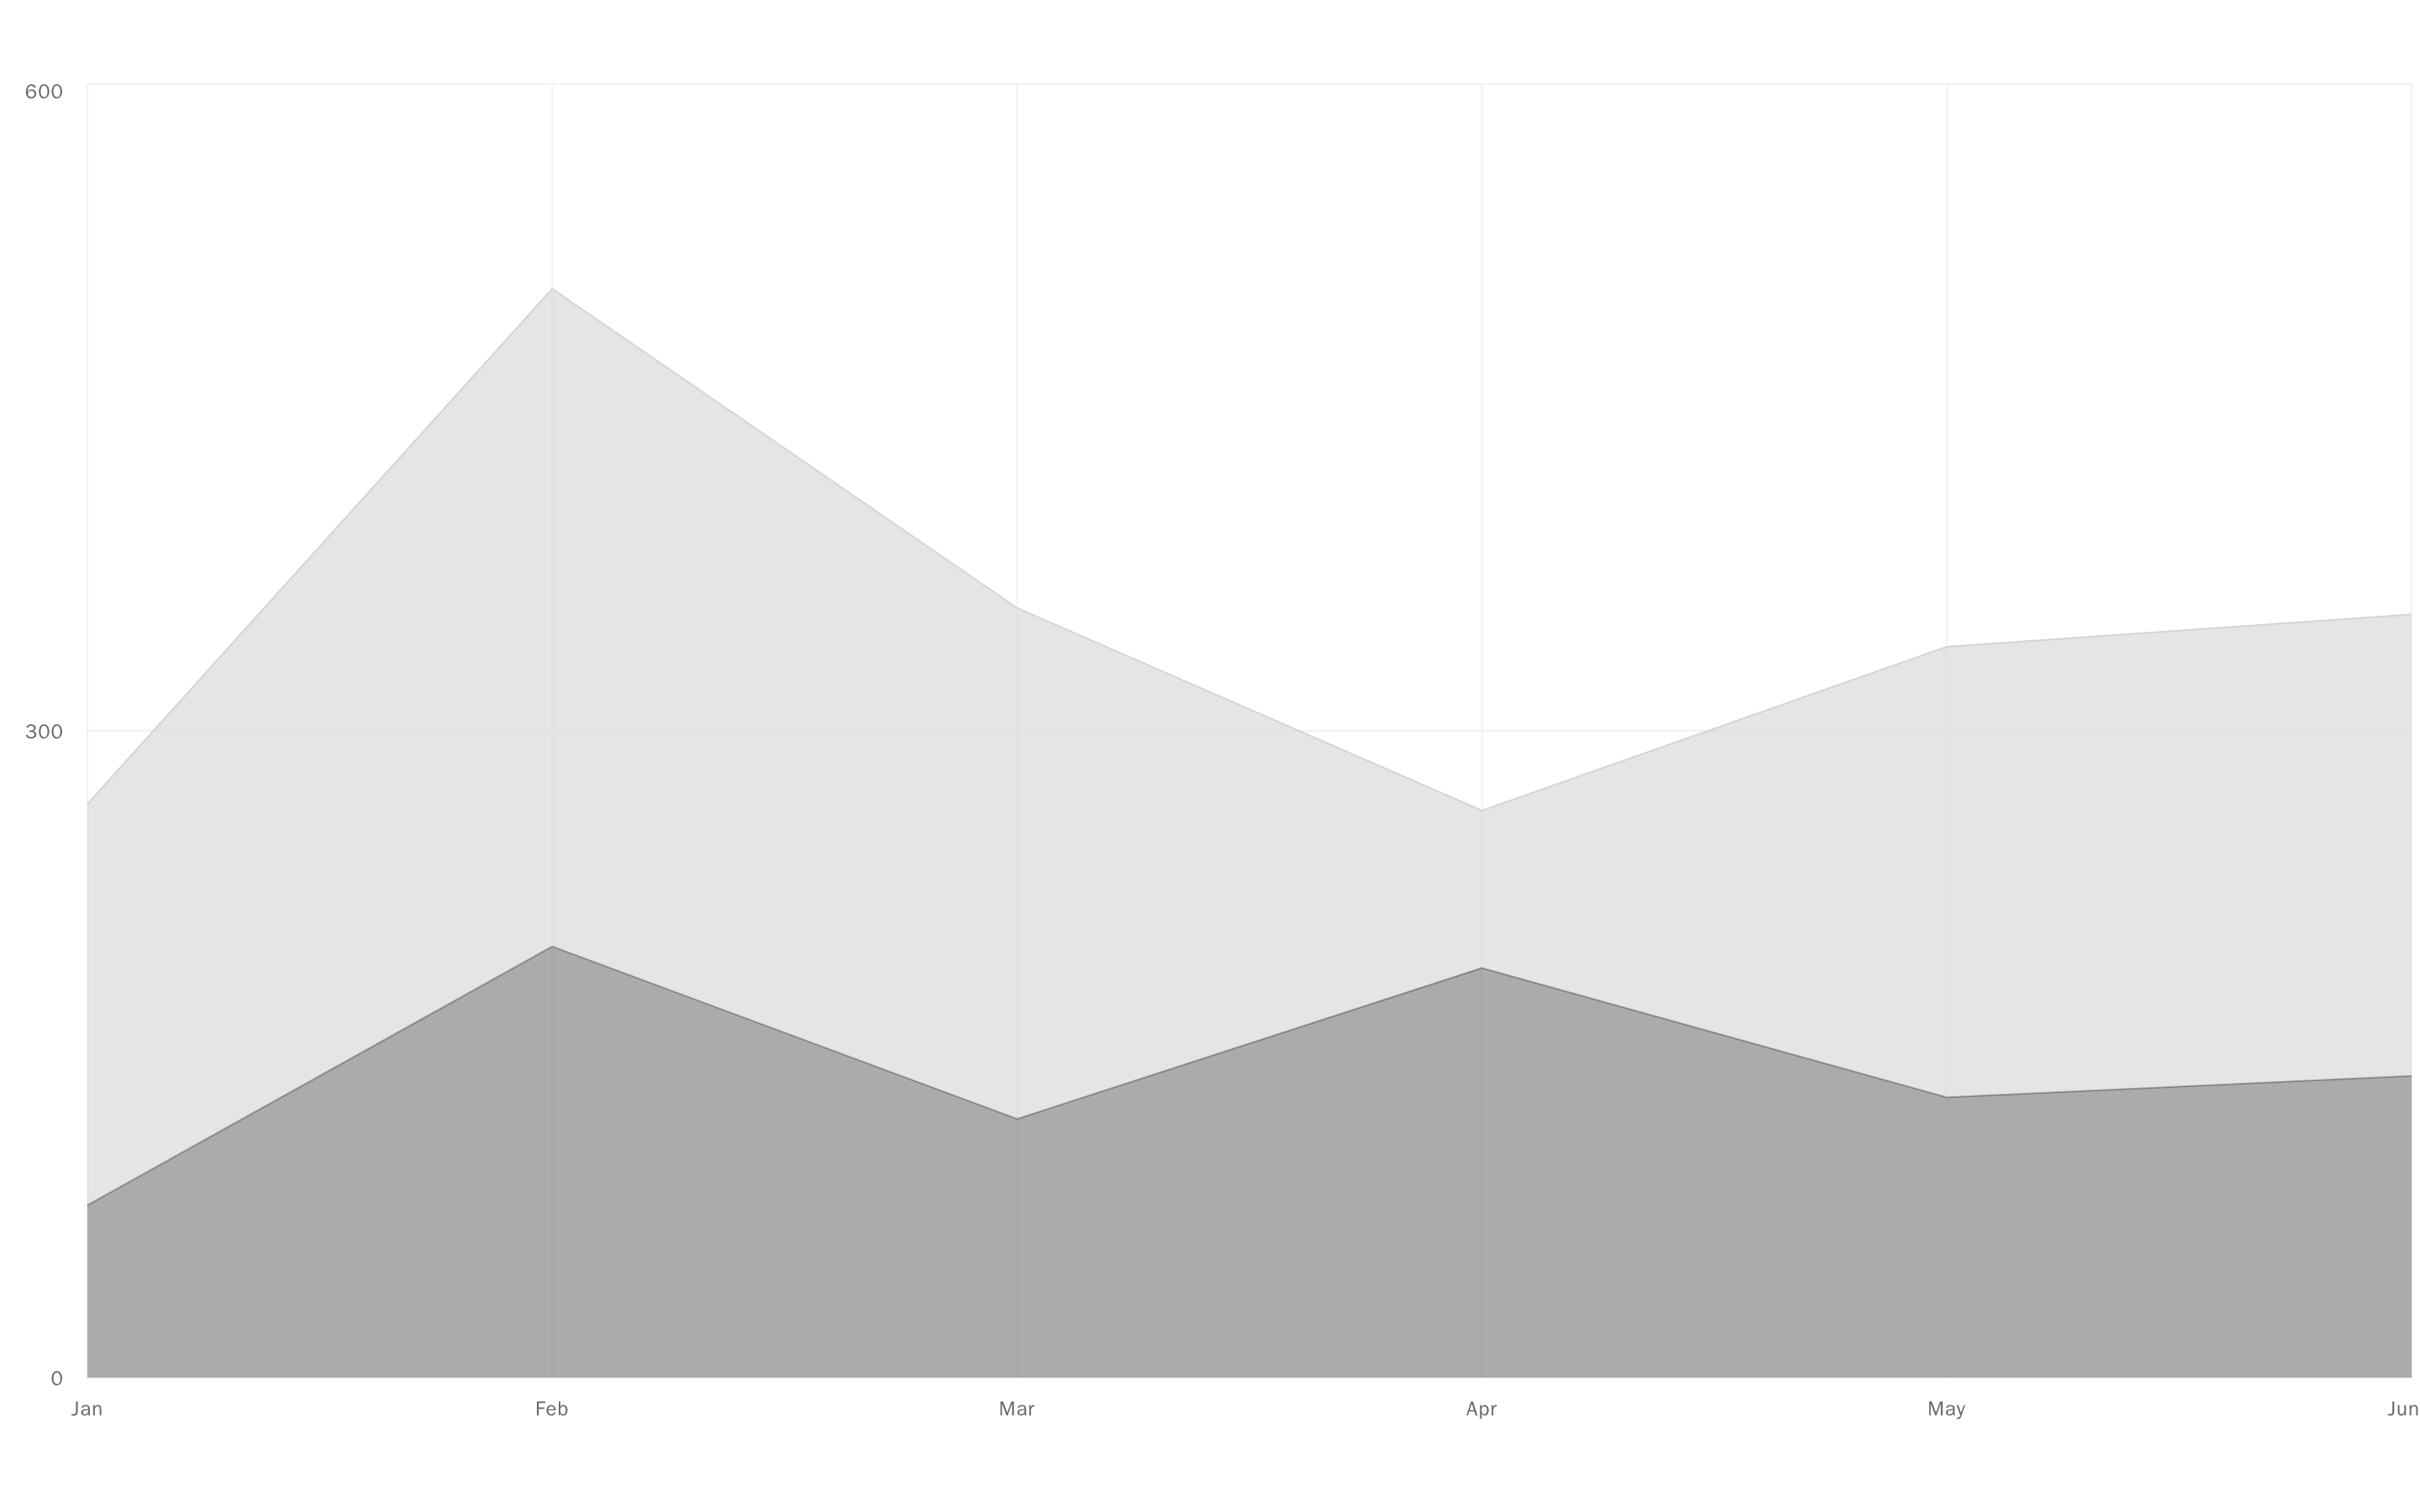
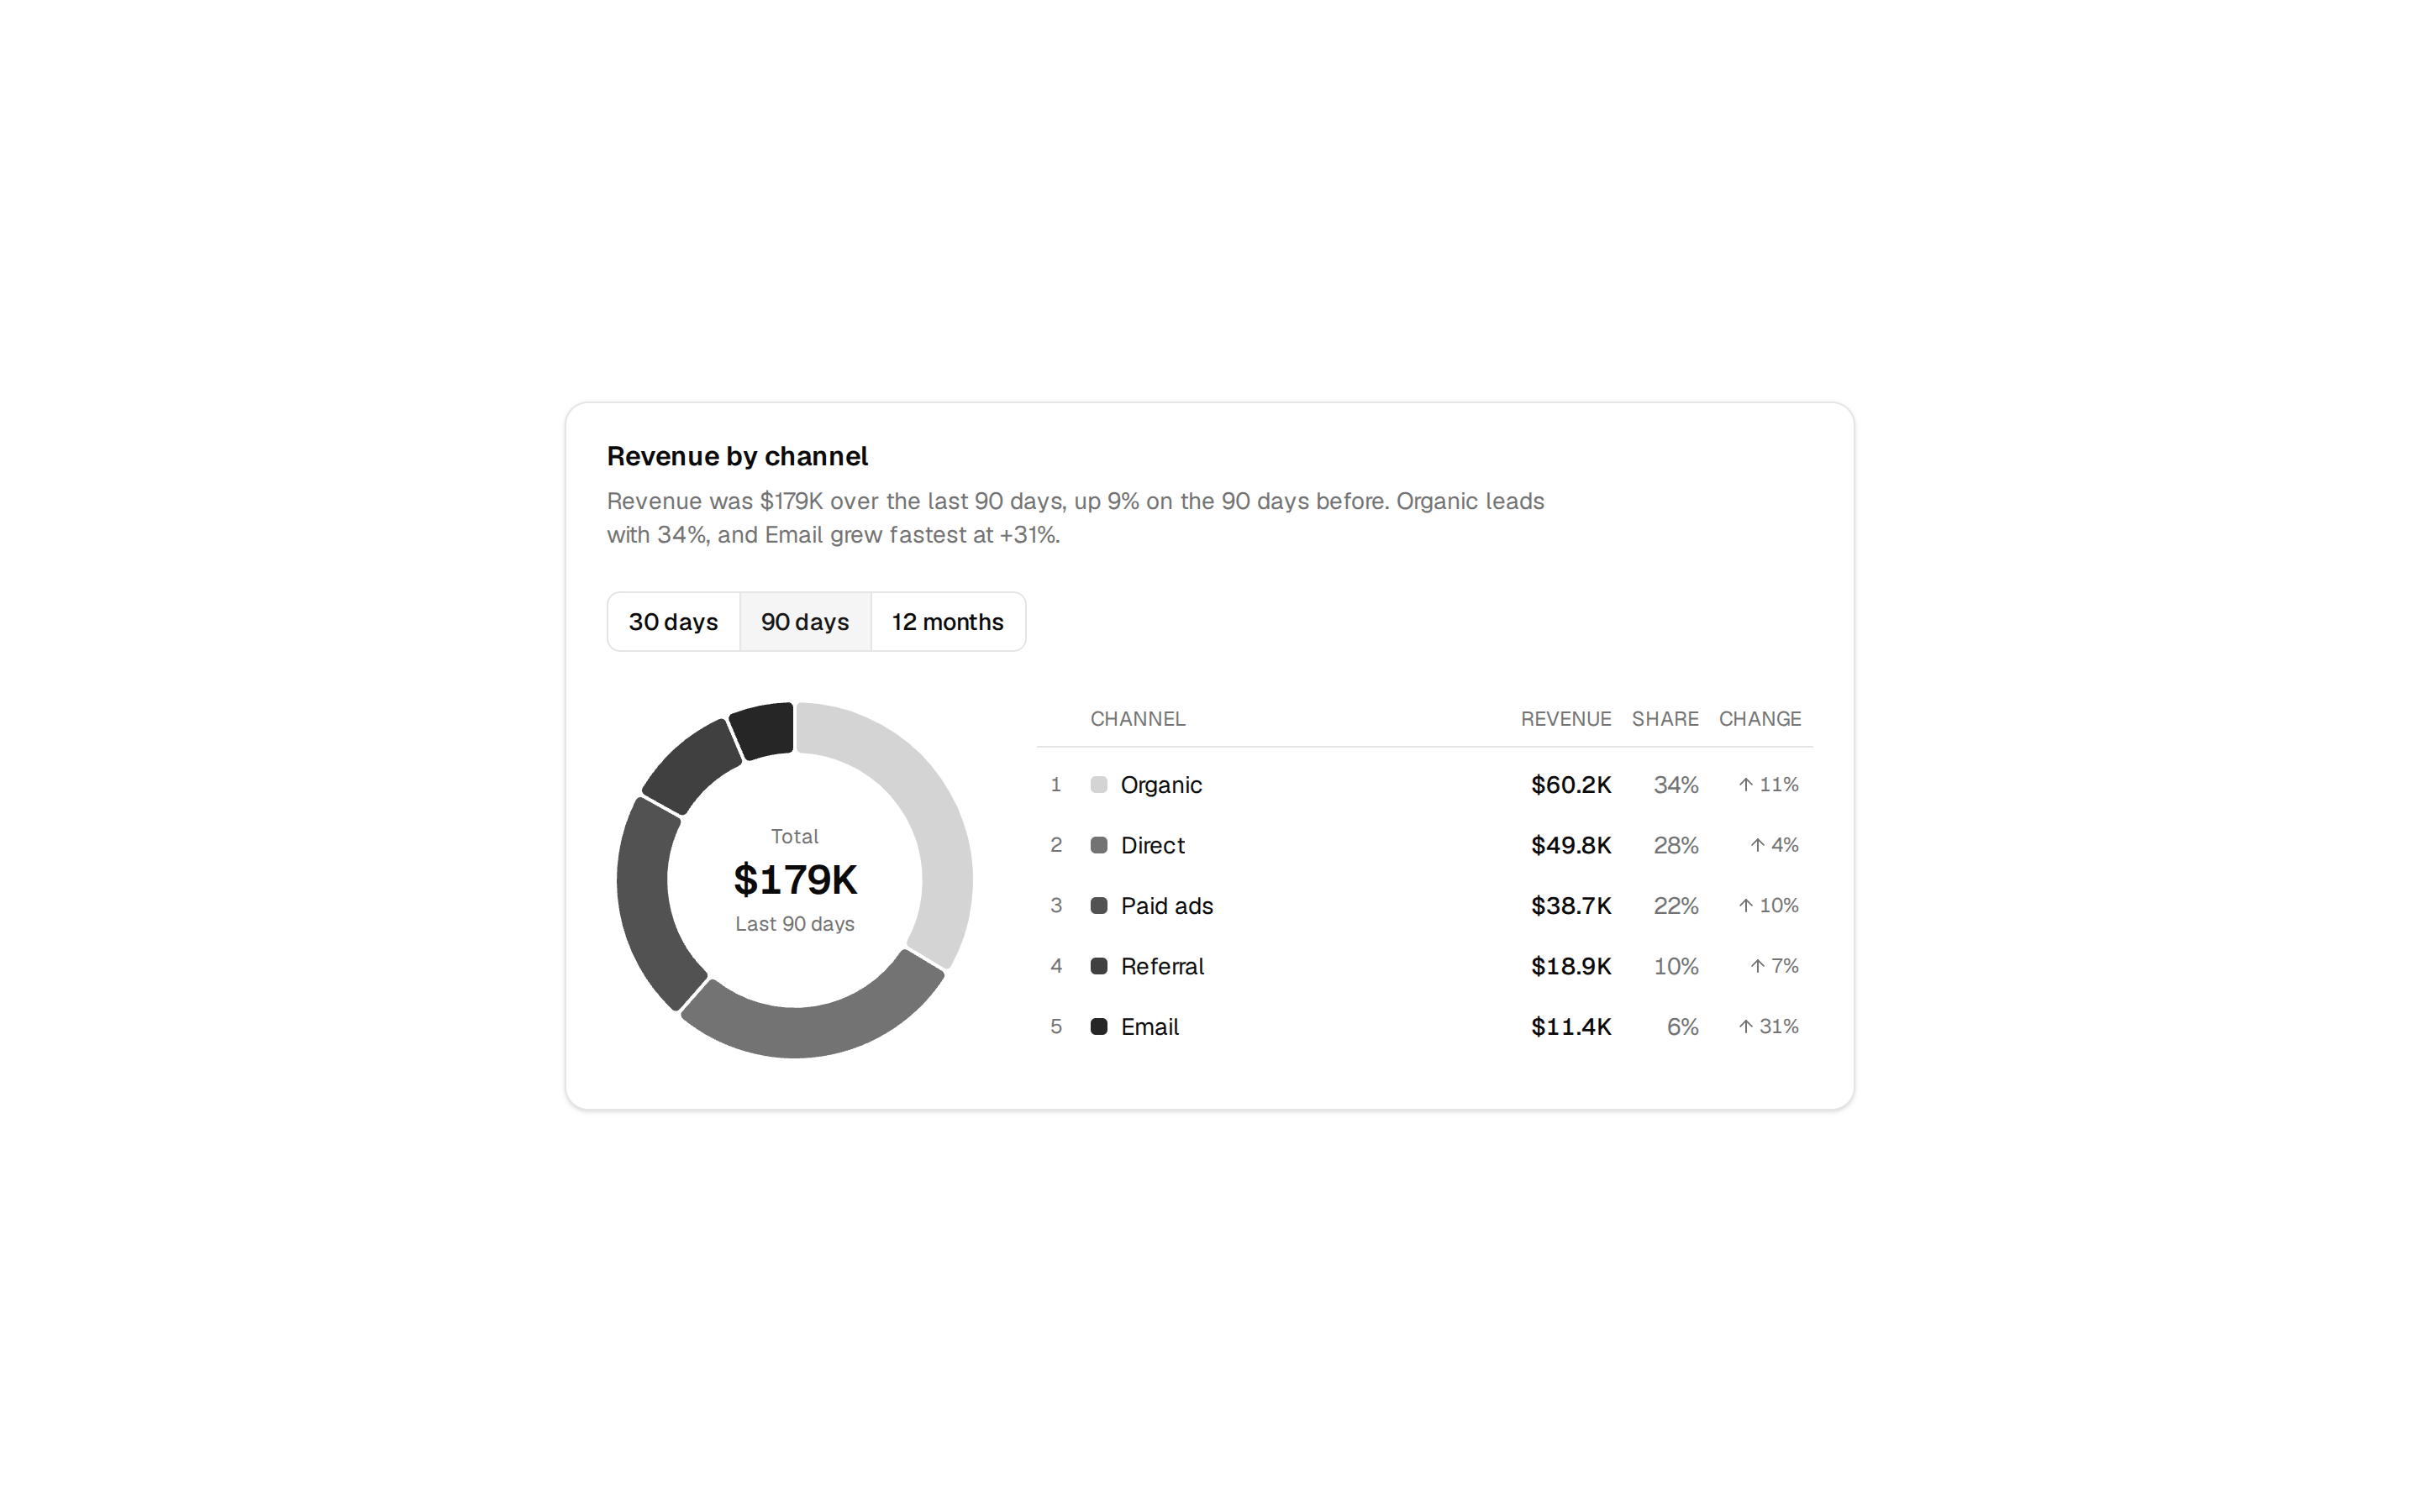
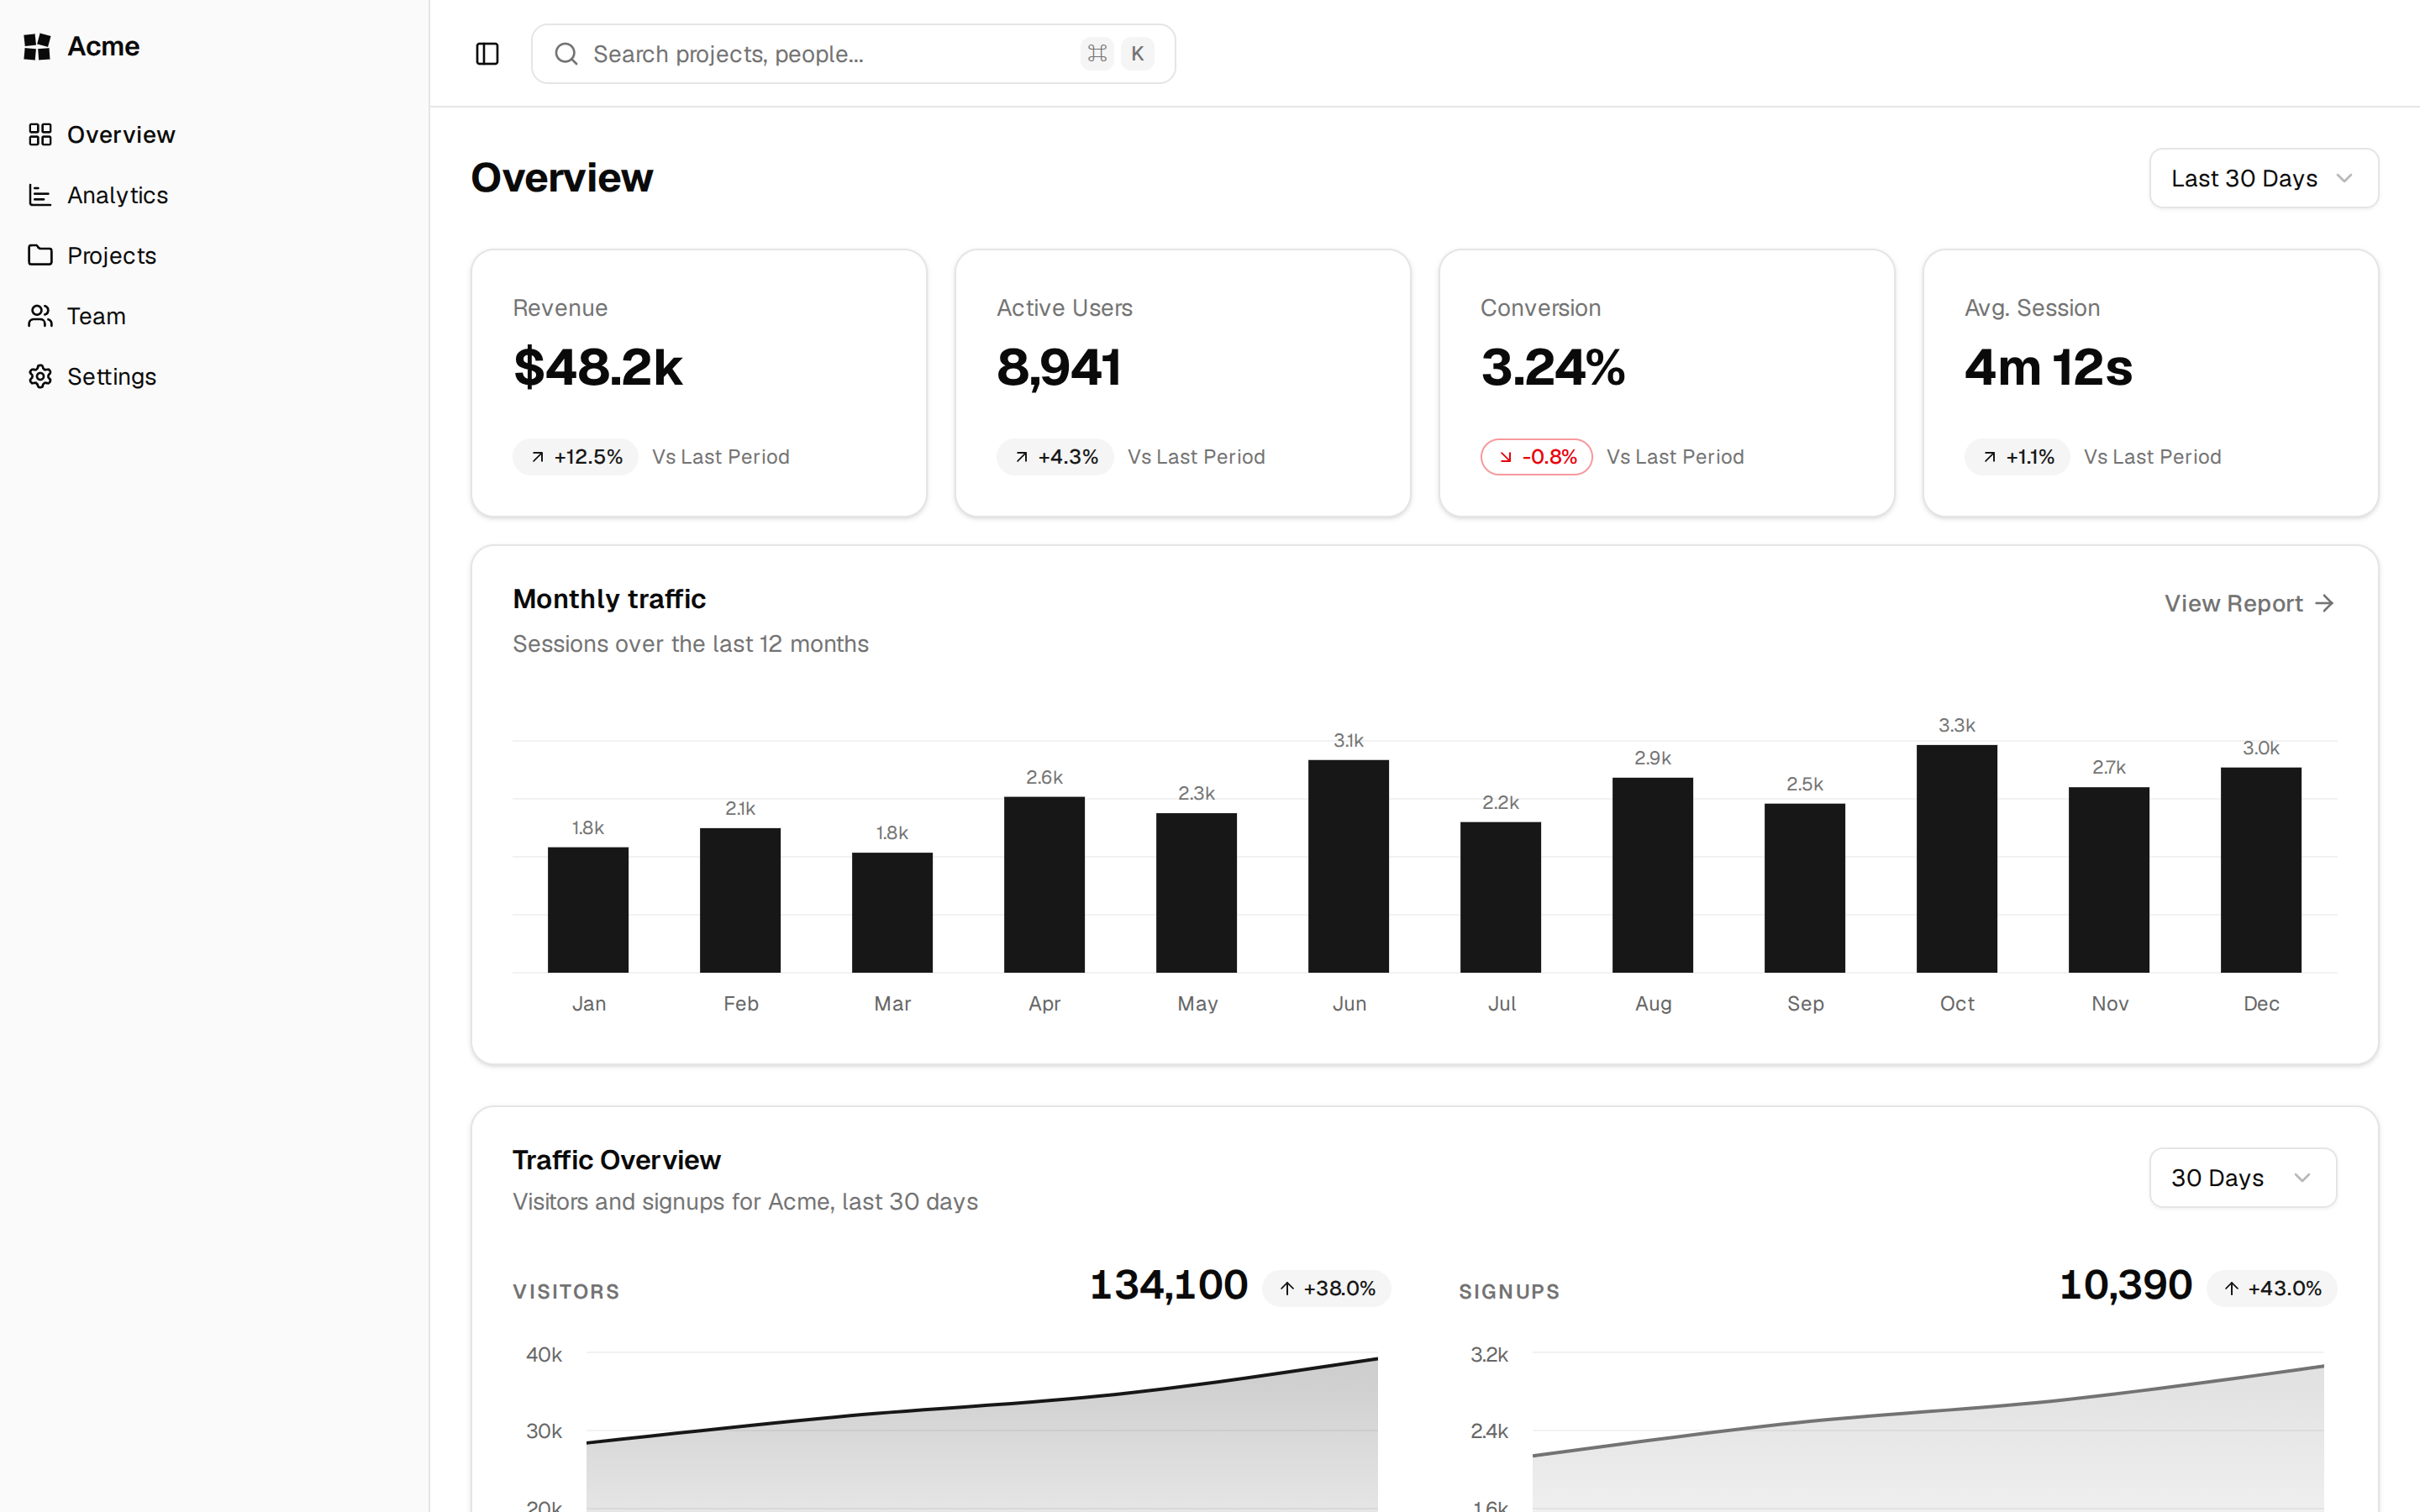
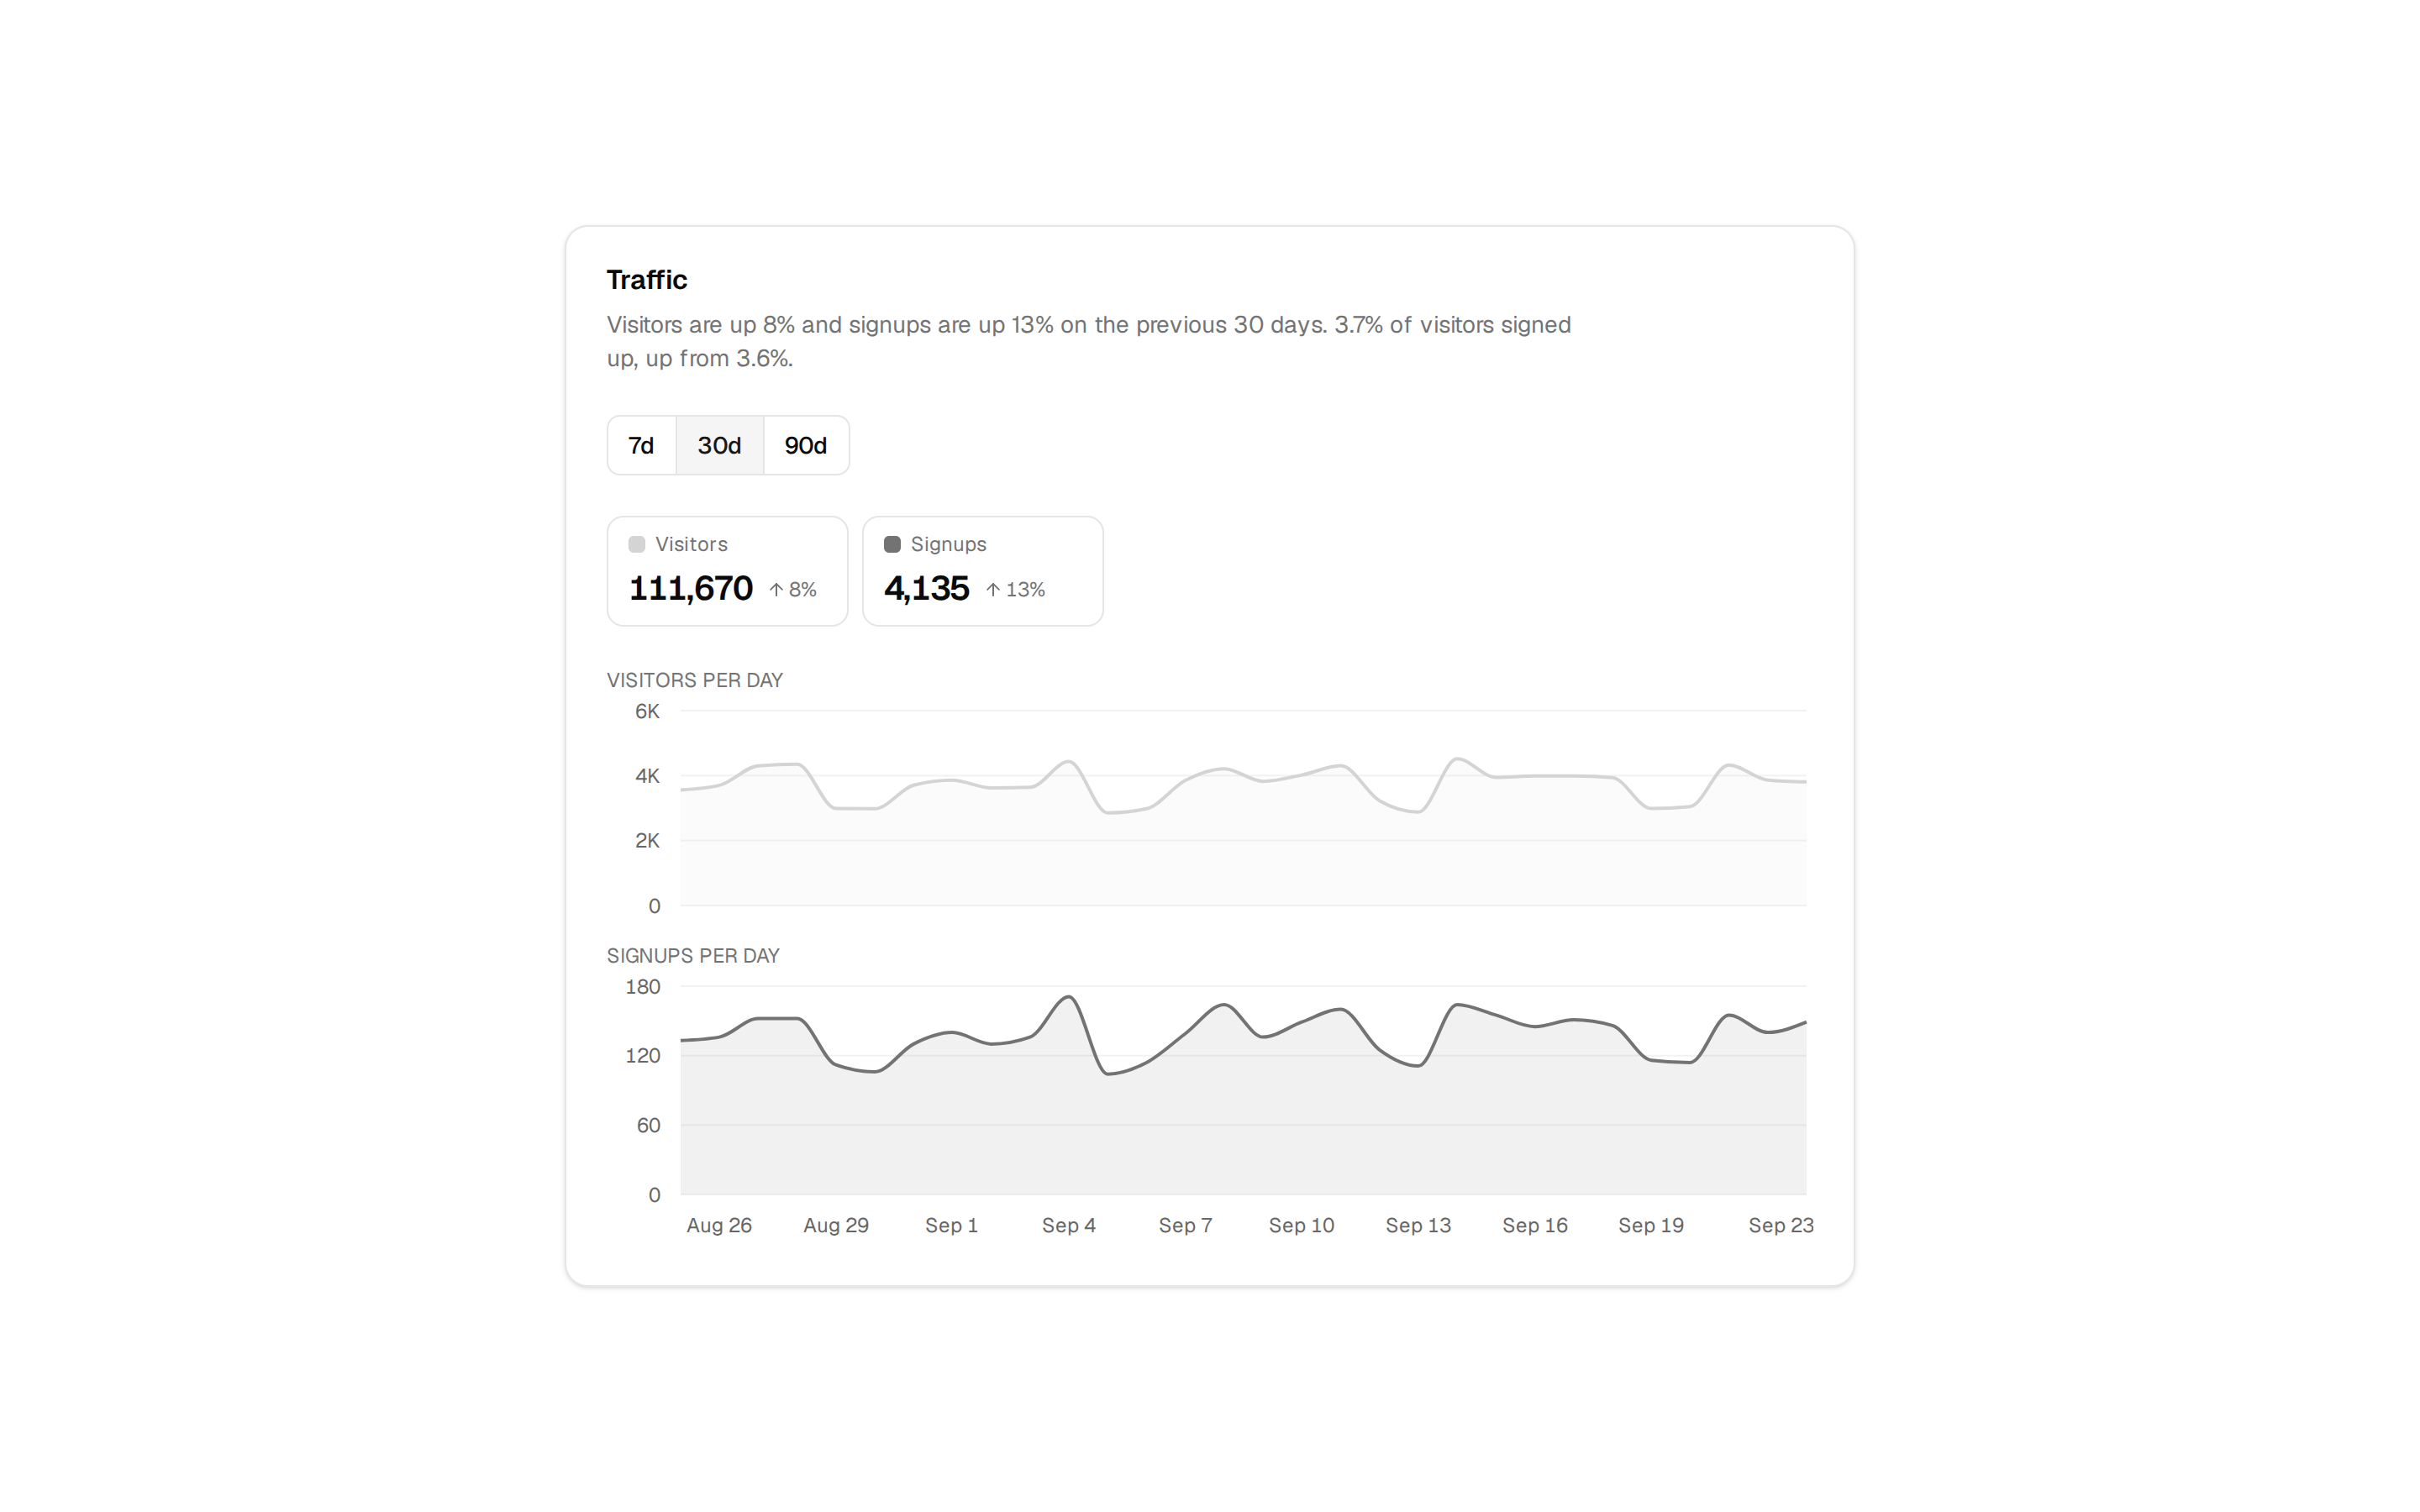
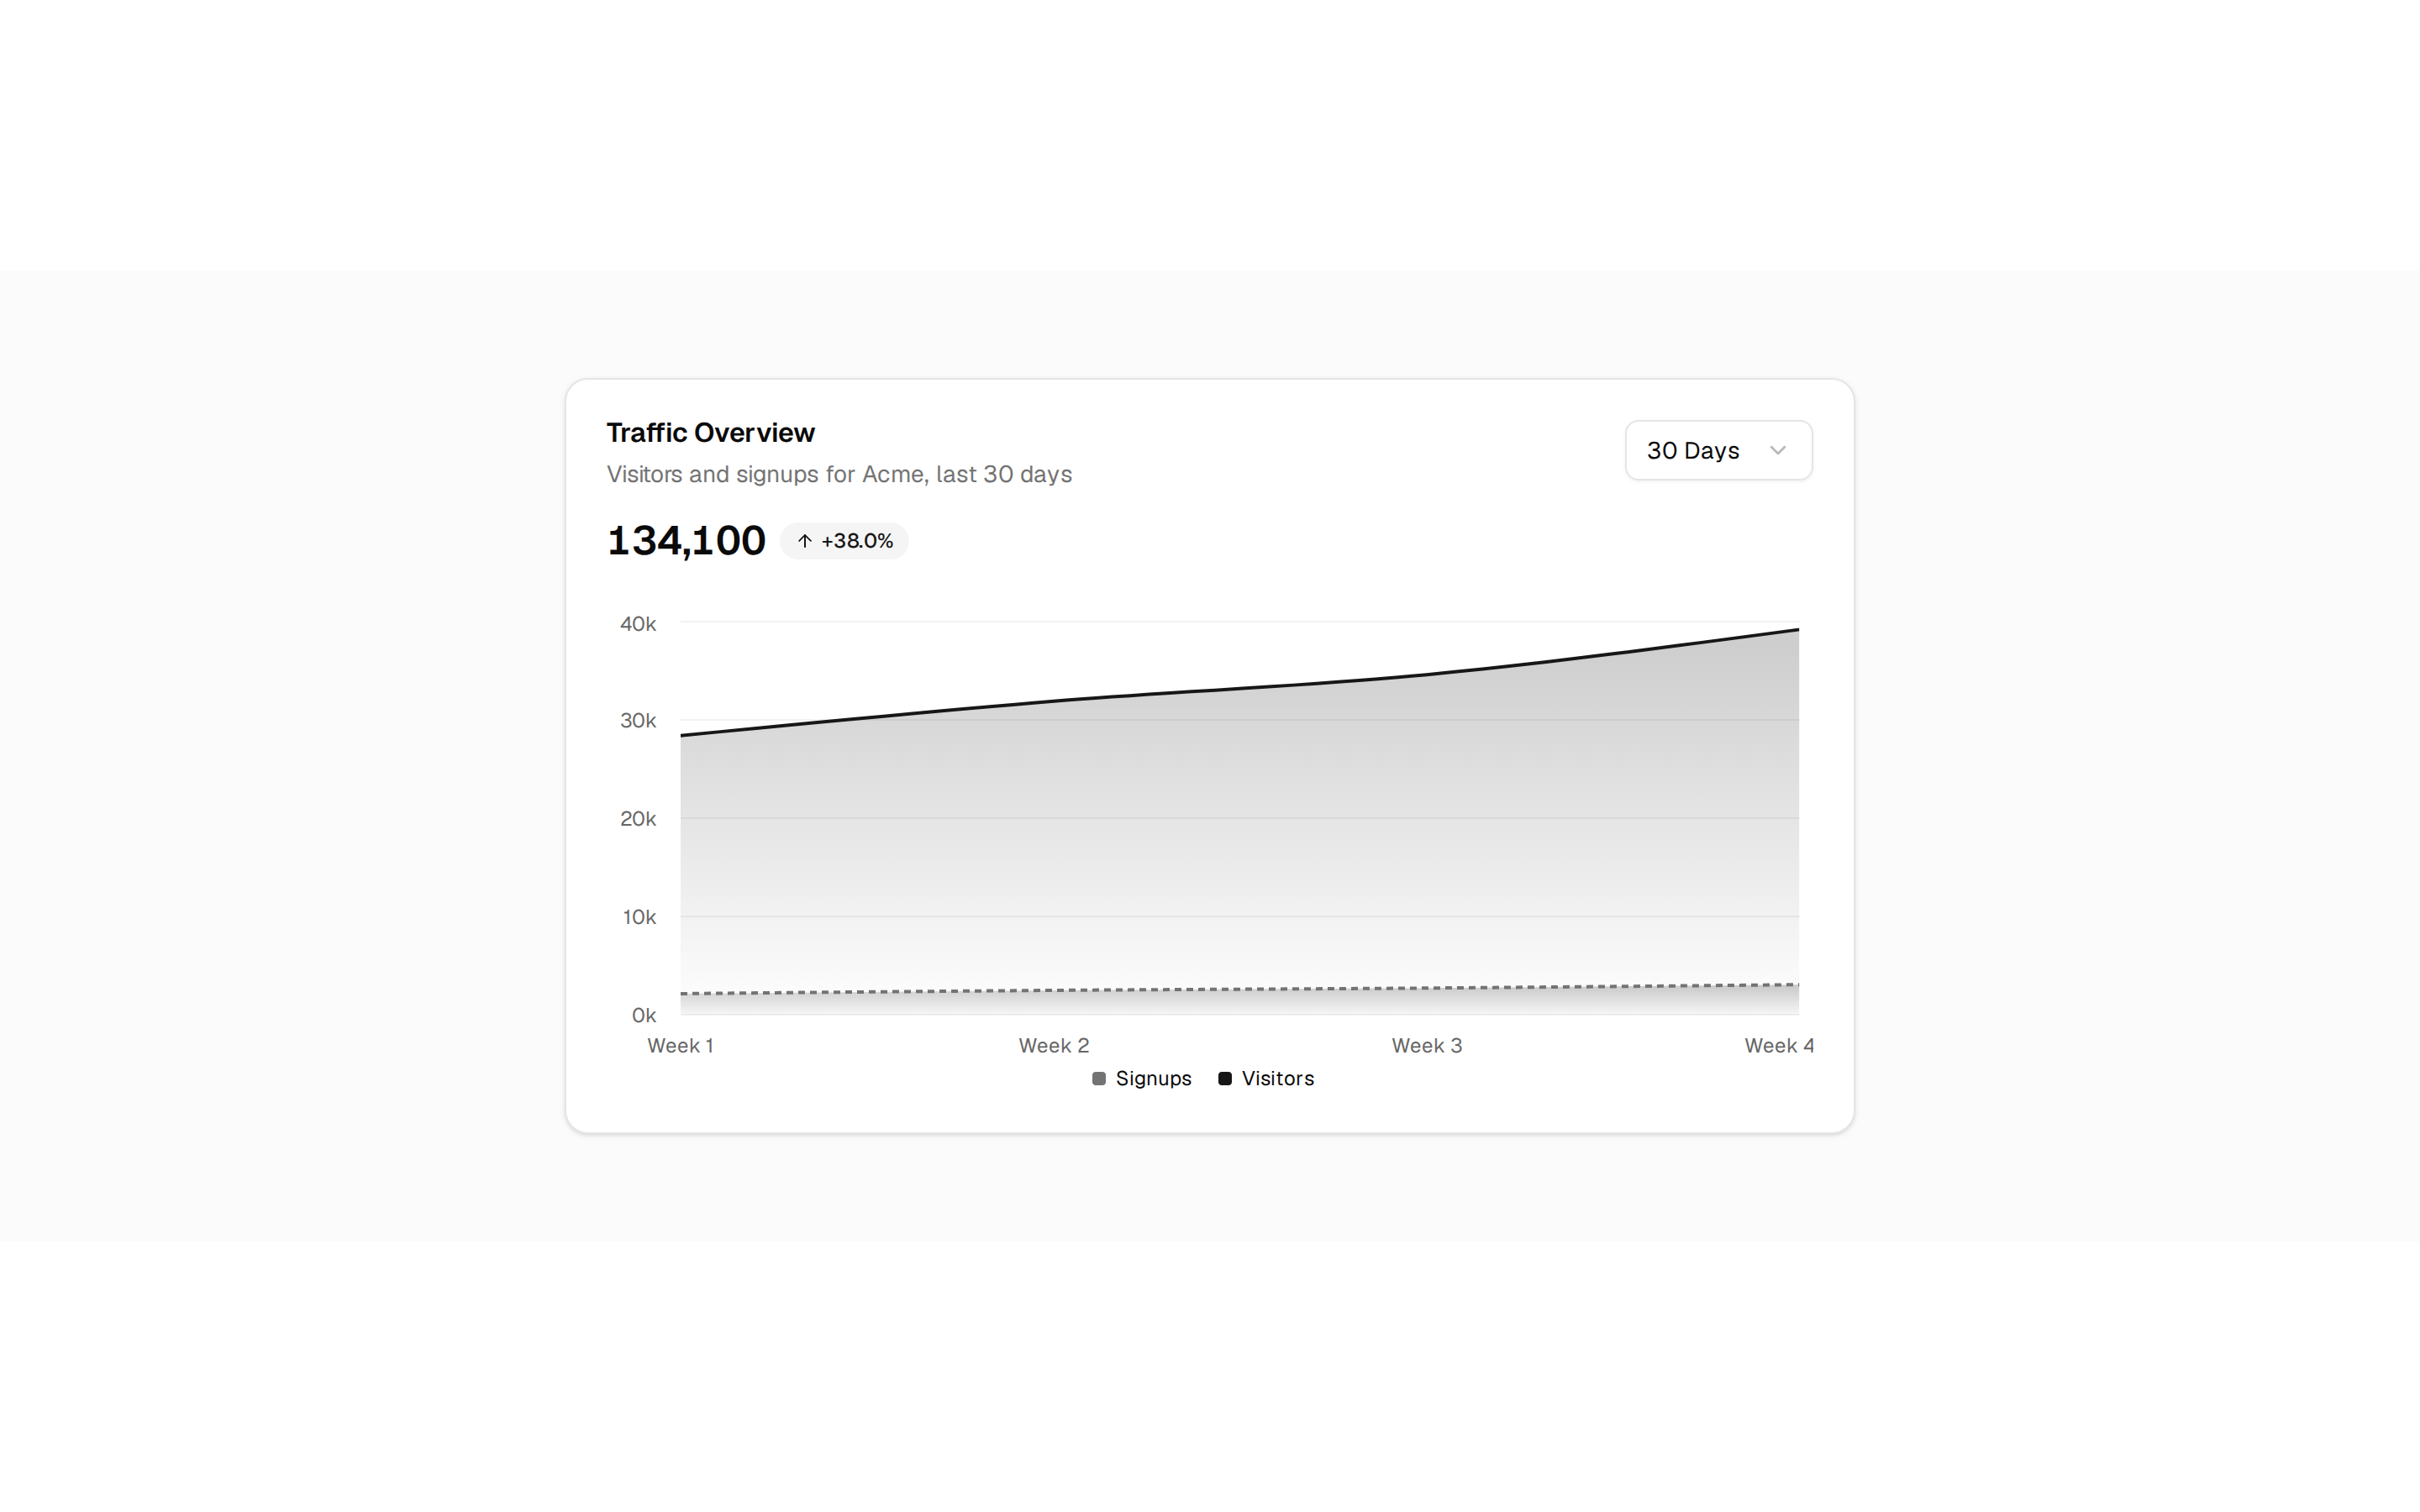
A gradient area chart whose tooltip heading shows a longer date than the axis ticks.
@esuiss
A gradient area chart whose tooltip heading shows a longer date than the axis ticks.
@esuiss
components/charts/tooltip-chart-label-formatter.tsx
"use client"

import * as React from "react"
import { Area, AreaChart, XAxis } from "recharts"

import {
  Card,
  CardContent,
  CardDescription,
  CardHeader,
  CardTitle,
} from "@/components/ui/card"
import {
  type ChartConfig,
  ChartContainer,
  ChartTooltip,
  ChartTooltipContent,
} from "@/components/ui/chart"

function dayKey(date: Date) {
  return [
    date.getFullYear(),
    String(date.getMonth() + 1).padStart(2, "0"),
    String(date.getDate()).padStart(2, "0"),
  ].join("-")
}

const chartData = [
  512, 604, 455, 389, 662, 598, 431, 520, 690, 447, 575, 402, 633, 558,
].map((energy, index) => ({
  date: dayKey(new Date(2026, 8, 23 + index)),
  energy,
}))

const chartConfig = {
  energy: { label: "Active energy", color: "var(--color-red-500)" },
} satisfies ChartConfig

const longDate = new Intl.DateTimeFormat("en-US", {
  weekday: "long",
  month: "long",
  day: "numeric",
})

export function TooltipChartLabelFormatter() {
  const id = React.useId()
  return (
    <Card variant="filled" size="sm">
      <CardHeader>
        <CardTitle>Custom label</CardTitle>
        <CardDescription>The date written out in full</CardDescription>
      </CardHeader>
      <CardContent>
        <ChartContainer
          config={chartConfig}
          className="aspect-auto h-52 w-full"
        >
          <AreaChart
            accessibilityLayer
            data={chartData}
            margin={{ top: 70, right: 12, left: 12, bottom: 0 }}
          >
            <defs>
              <linearGradient id={id} x1="0" y1="0" x2="0" y2="1">
                <stop
                  offset="0%"
                  stopColor="var(--color-energy)"
                  stopOpacity={0.38}
                />
                <stop
                  offset="100%"
                  stopColor="var(--color-energy)"
                  stopOpacity={0.02}
                />
              </linearGradient>
            </defs>
            <XAxis
              dataKey="date"
              tickLine={false}
              axisLine={false}
              tickMargin={8}
              interval={2}
              tickFormatter={(value: string) => String(Number(value.slice(8)))}
            />
            <ChartTooltip
              defaultIndex={8}
              content={
                <ChartTooltipContent
                  indicator="line"
                  labelFormatter={(_, payload) =>
                    longDate.format(
                      new Date(`${payload[0]?.payload.date}T12:00:00`)
                    )
                  }
                />
              }
            />
            <Area
              dataKey="energy"
              type="monotone"
              stroke="var(--color-energy)"
              strokeWidth={2}
              fill={`url(#${id})`}
            />
          </AreaChart>
        </ChartContainer>
      </CardContent>
    </Card>
  )
}