


You may also like
See all

















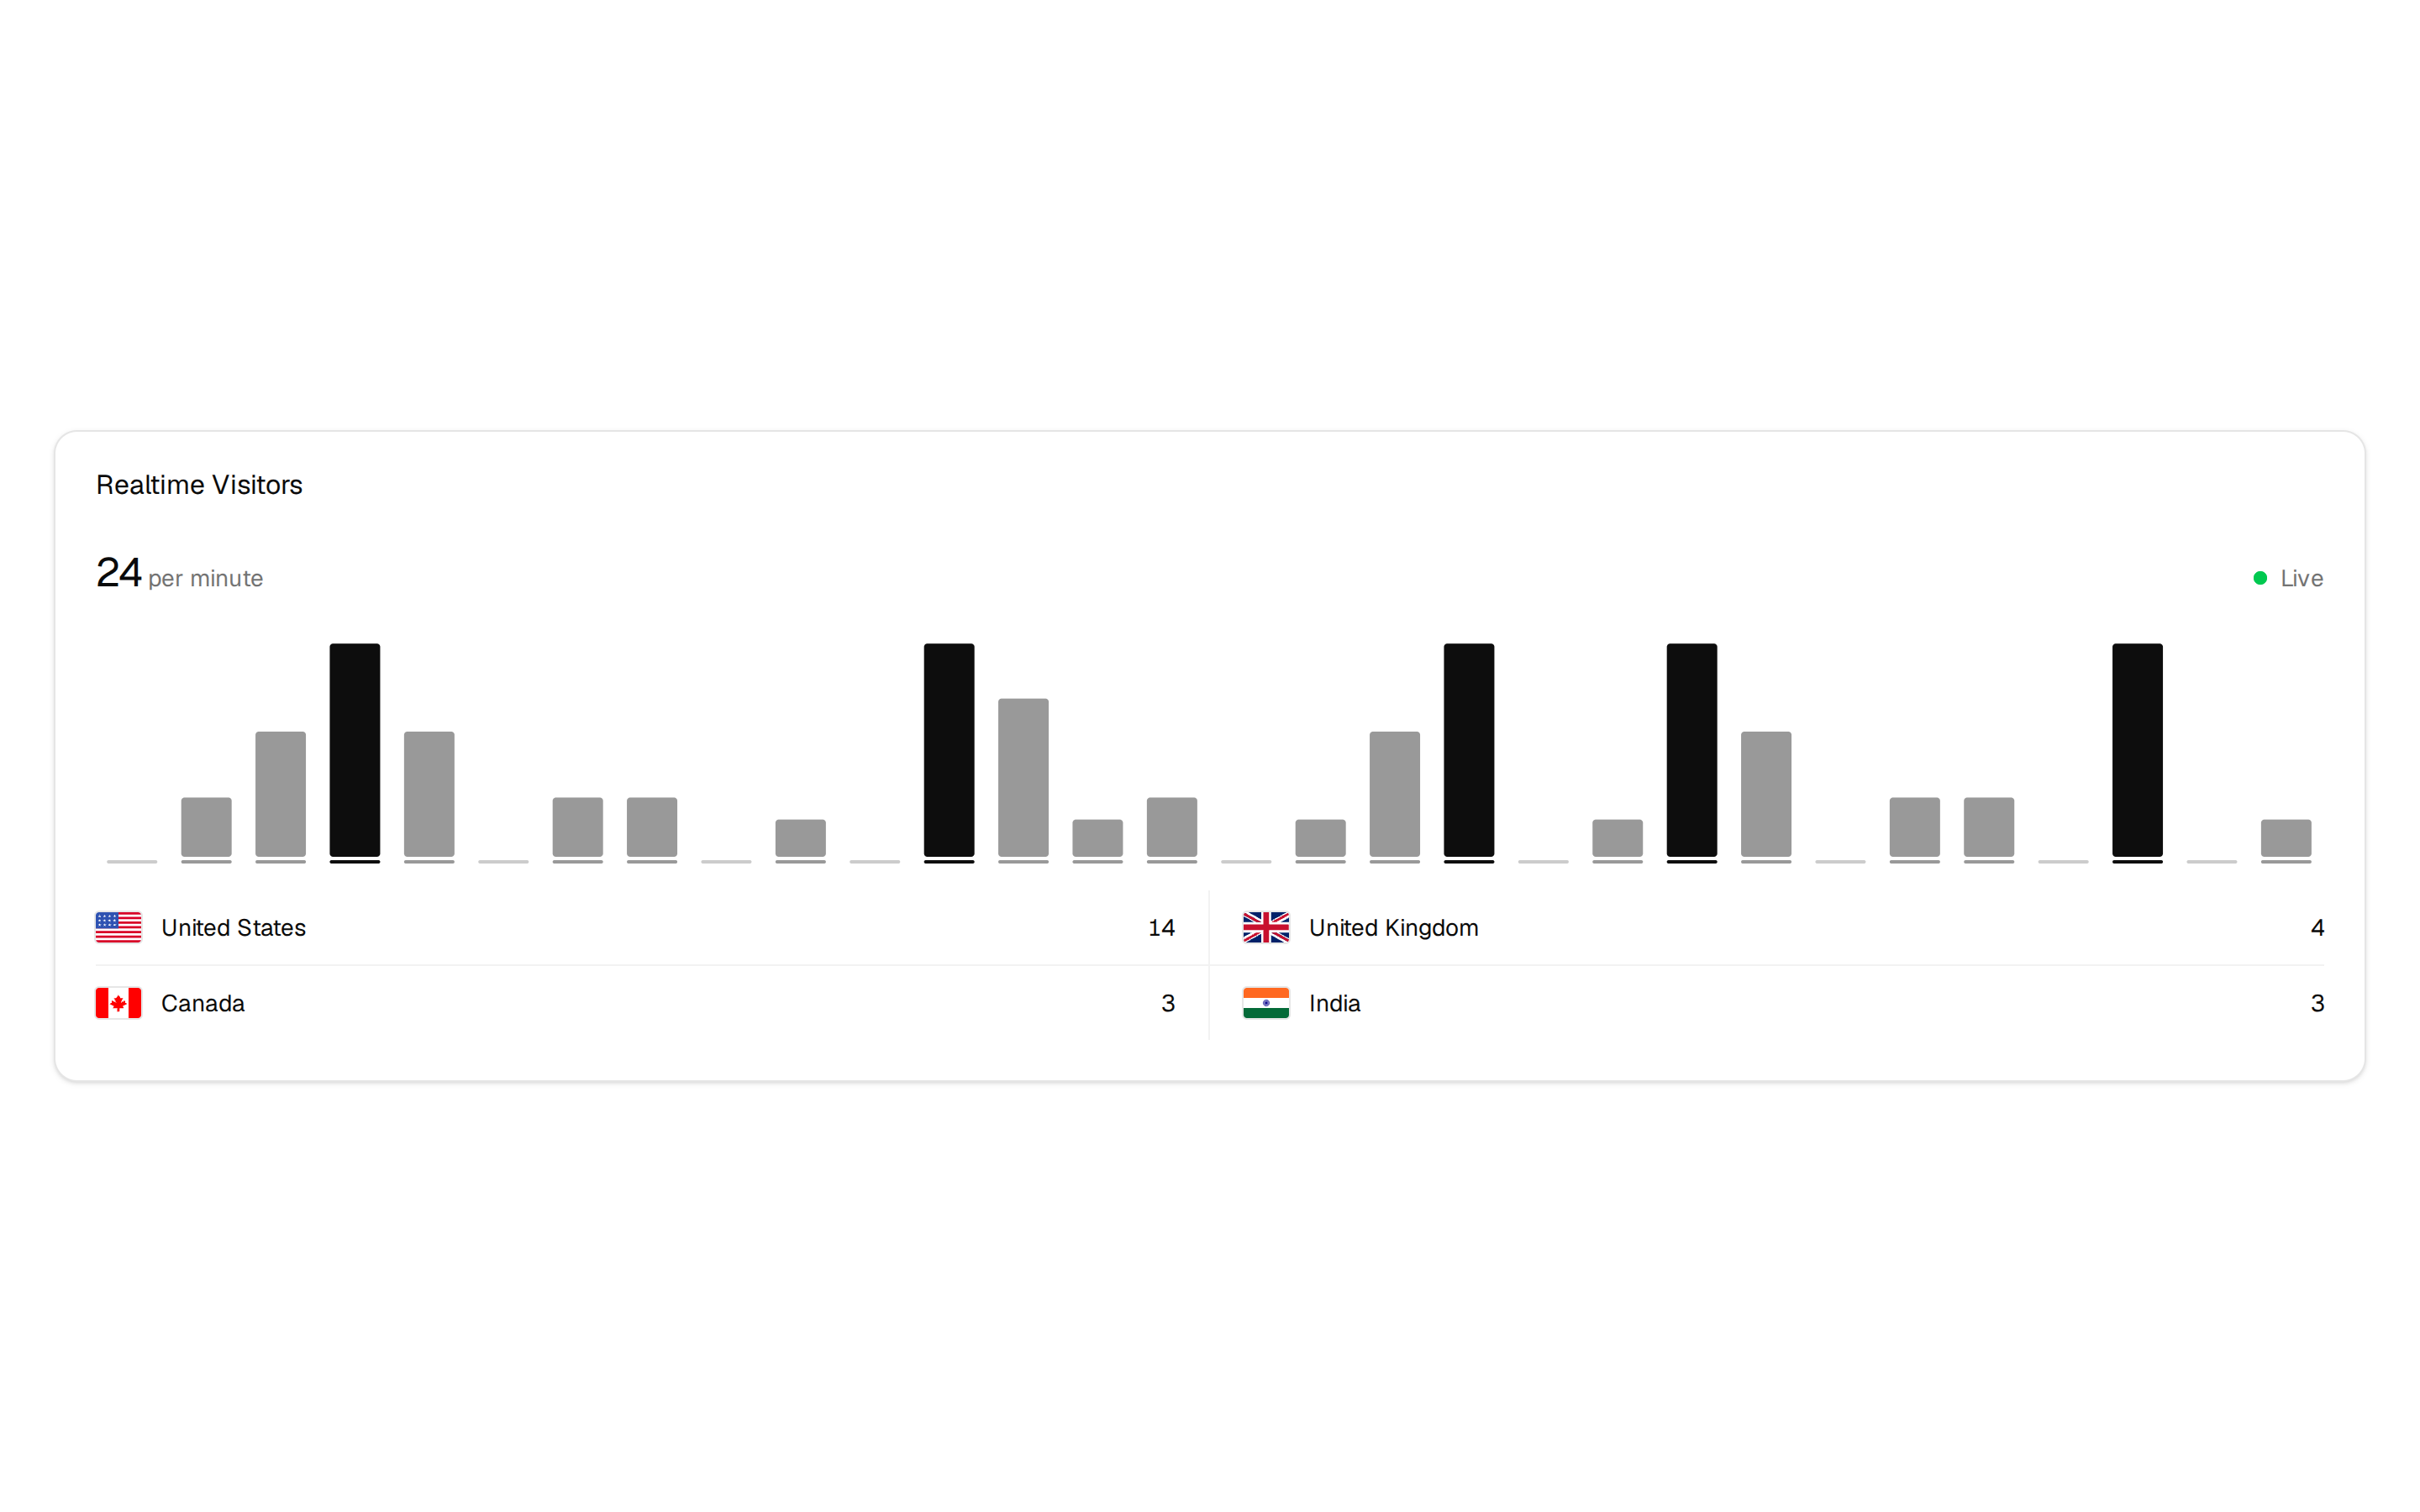



















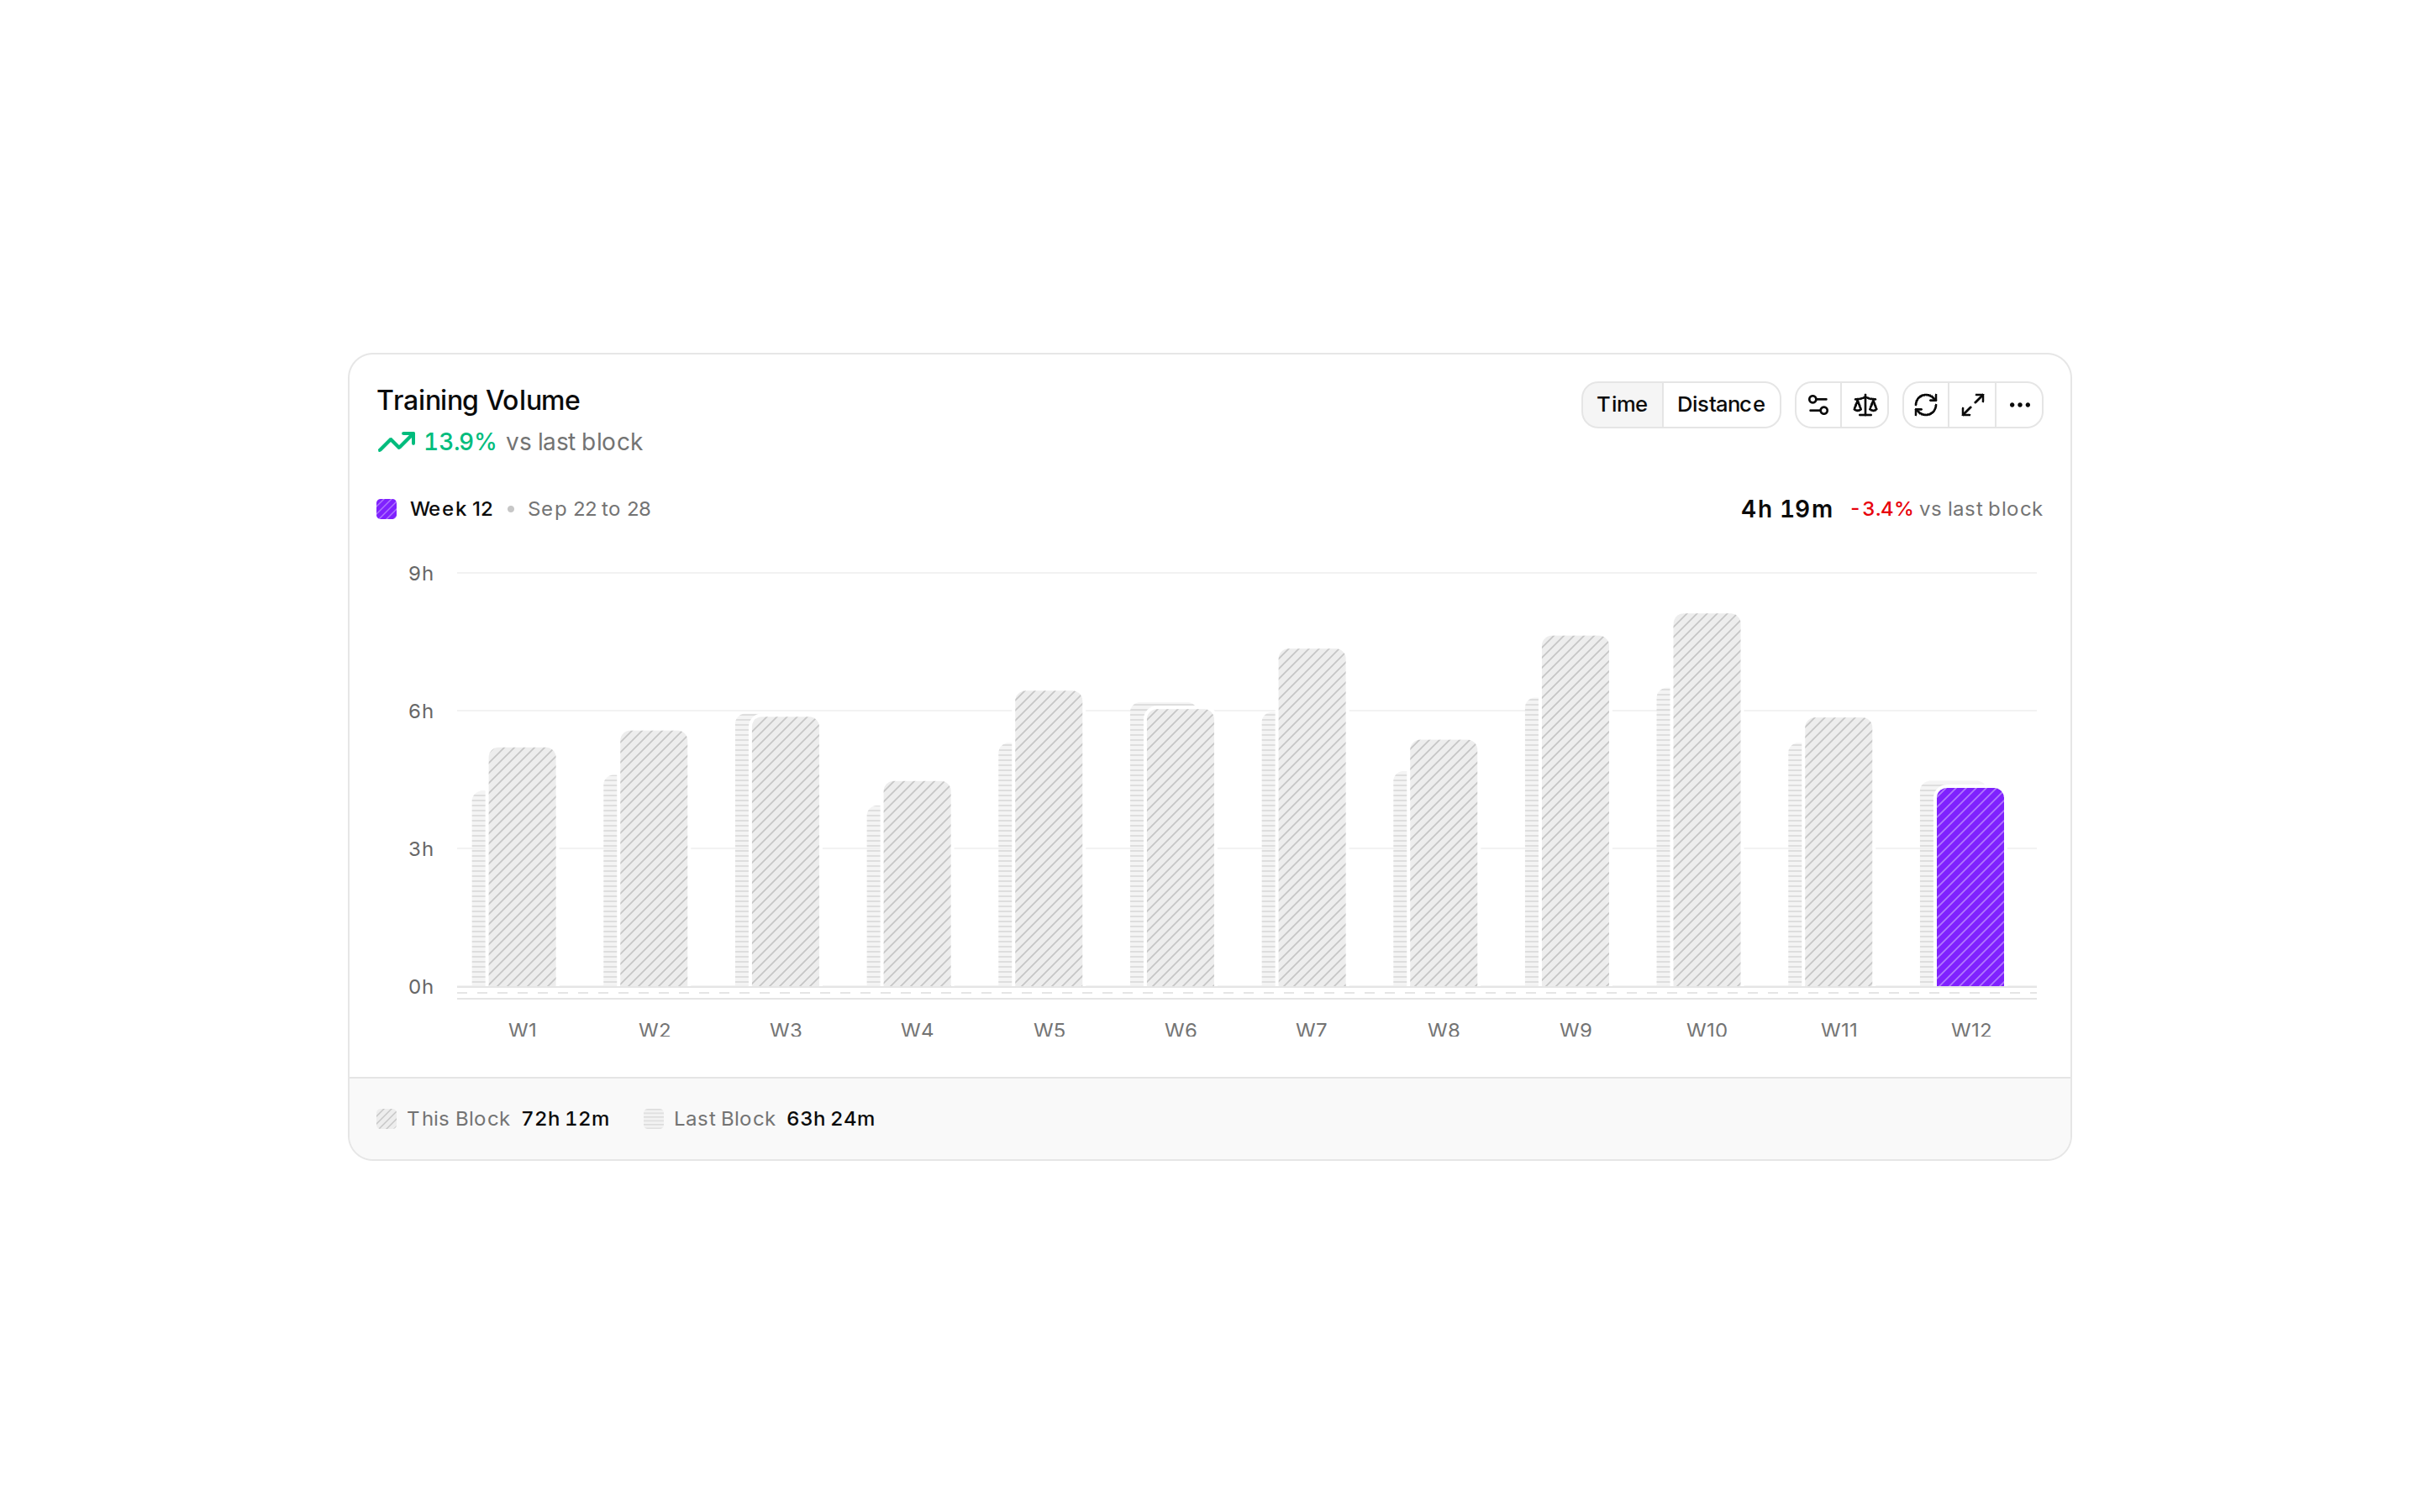
registry/default/chart-variants/c-chart-tooltip-presets-2.tsx
"use client";

import { Bar, BarChart, CartesianGrid, XAxis } from "recharts";
import { ChartTooltipTotal } from "@/registry/default/charts/chart-tooltip-presets";
import {
  buildChartConfig,
  formatCurrency,
} from "@/registry/default/lib/chart-utils";
import { ChartContainer, ChartTooltip } from "@/registry/default/ui/chart";

const data = [
  { enterprise: 14200, month: "Jan", pro: 21800, starter: 6400 },
  { enterprise: 15100, month: "Feb", pro: 23100, starter: 6900 },
  { enterprise: 16800, month: "Mar", pro: 24400, starter: 7300 },
  { enterprise: 17200, month: "Apr", pro: 26900, starter: 7100 },
  { enterprise: 19500, month: "May", pro: 28300, starter: 7800 },
  { enterprise: 21400, month: "Jun", pro: 30200, starter: 8200 },
];

const categories = ["starter", "pro", "enterprise"];
const config = buildChartConfig(categories);

export default function MrrByPlan() {
  return (
    <ChartContainer className="h-64 w-full" config={config}>
      <BarChart accessibilityLayer data={data}>
        <CartesianGrid vertical={false} />
        <XAxis
          axisLine={false}
          dataKey="month"
          tickLine={false}
          tickMargin={8}
        />
        <ChartTooltip
          content={
            <ChartTooltipTotal
              config={config}
              totalLabel="Total MRR"
              valueFormatter={formatCurrency}
            />
          }
          cursor={false}
        />
        {categories.map((key, i) => (
          <Bar
            dataKey={key}
            fill={`var(--color-${key})`}
            key={key}
            radius={i === categories.length - 1 ? [4, 4, 0, 0] : 0}
            stackId="mrr"
          />
        ))}
      </BarChart>
    </ChartContainer>
  );
}







