Dashboard 5
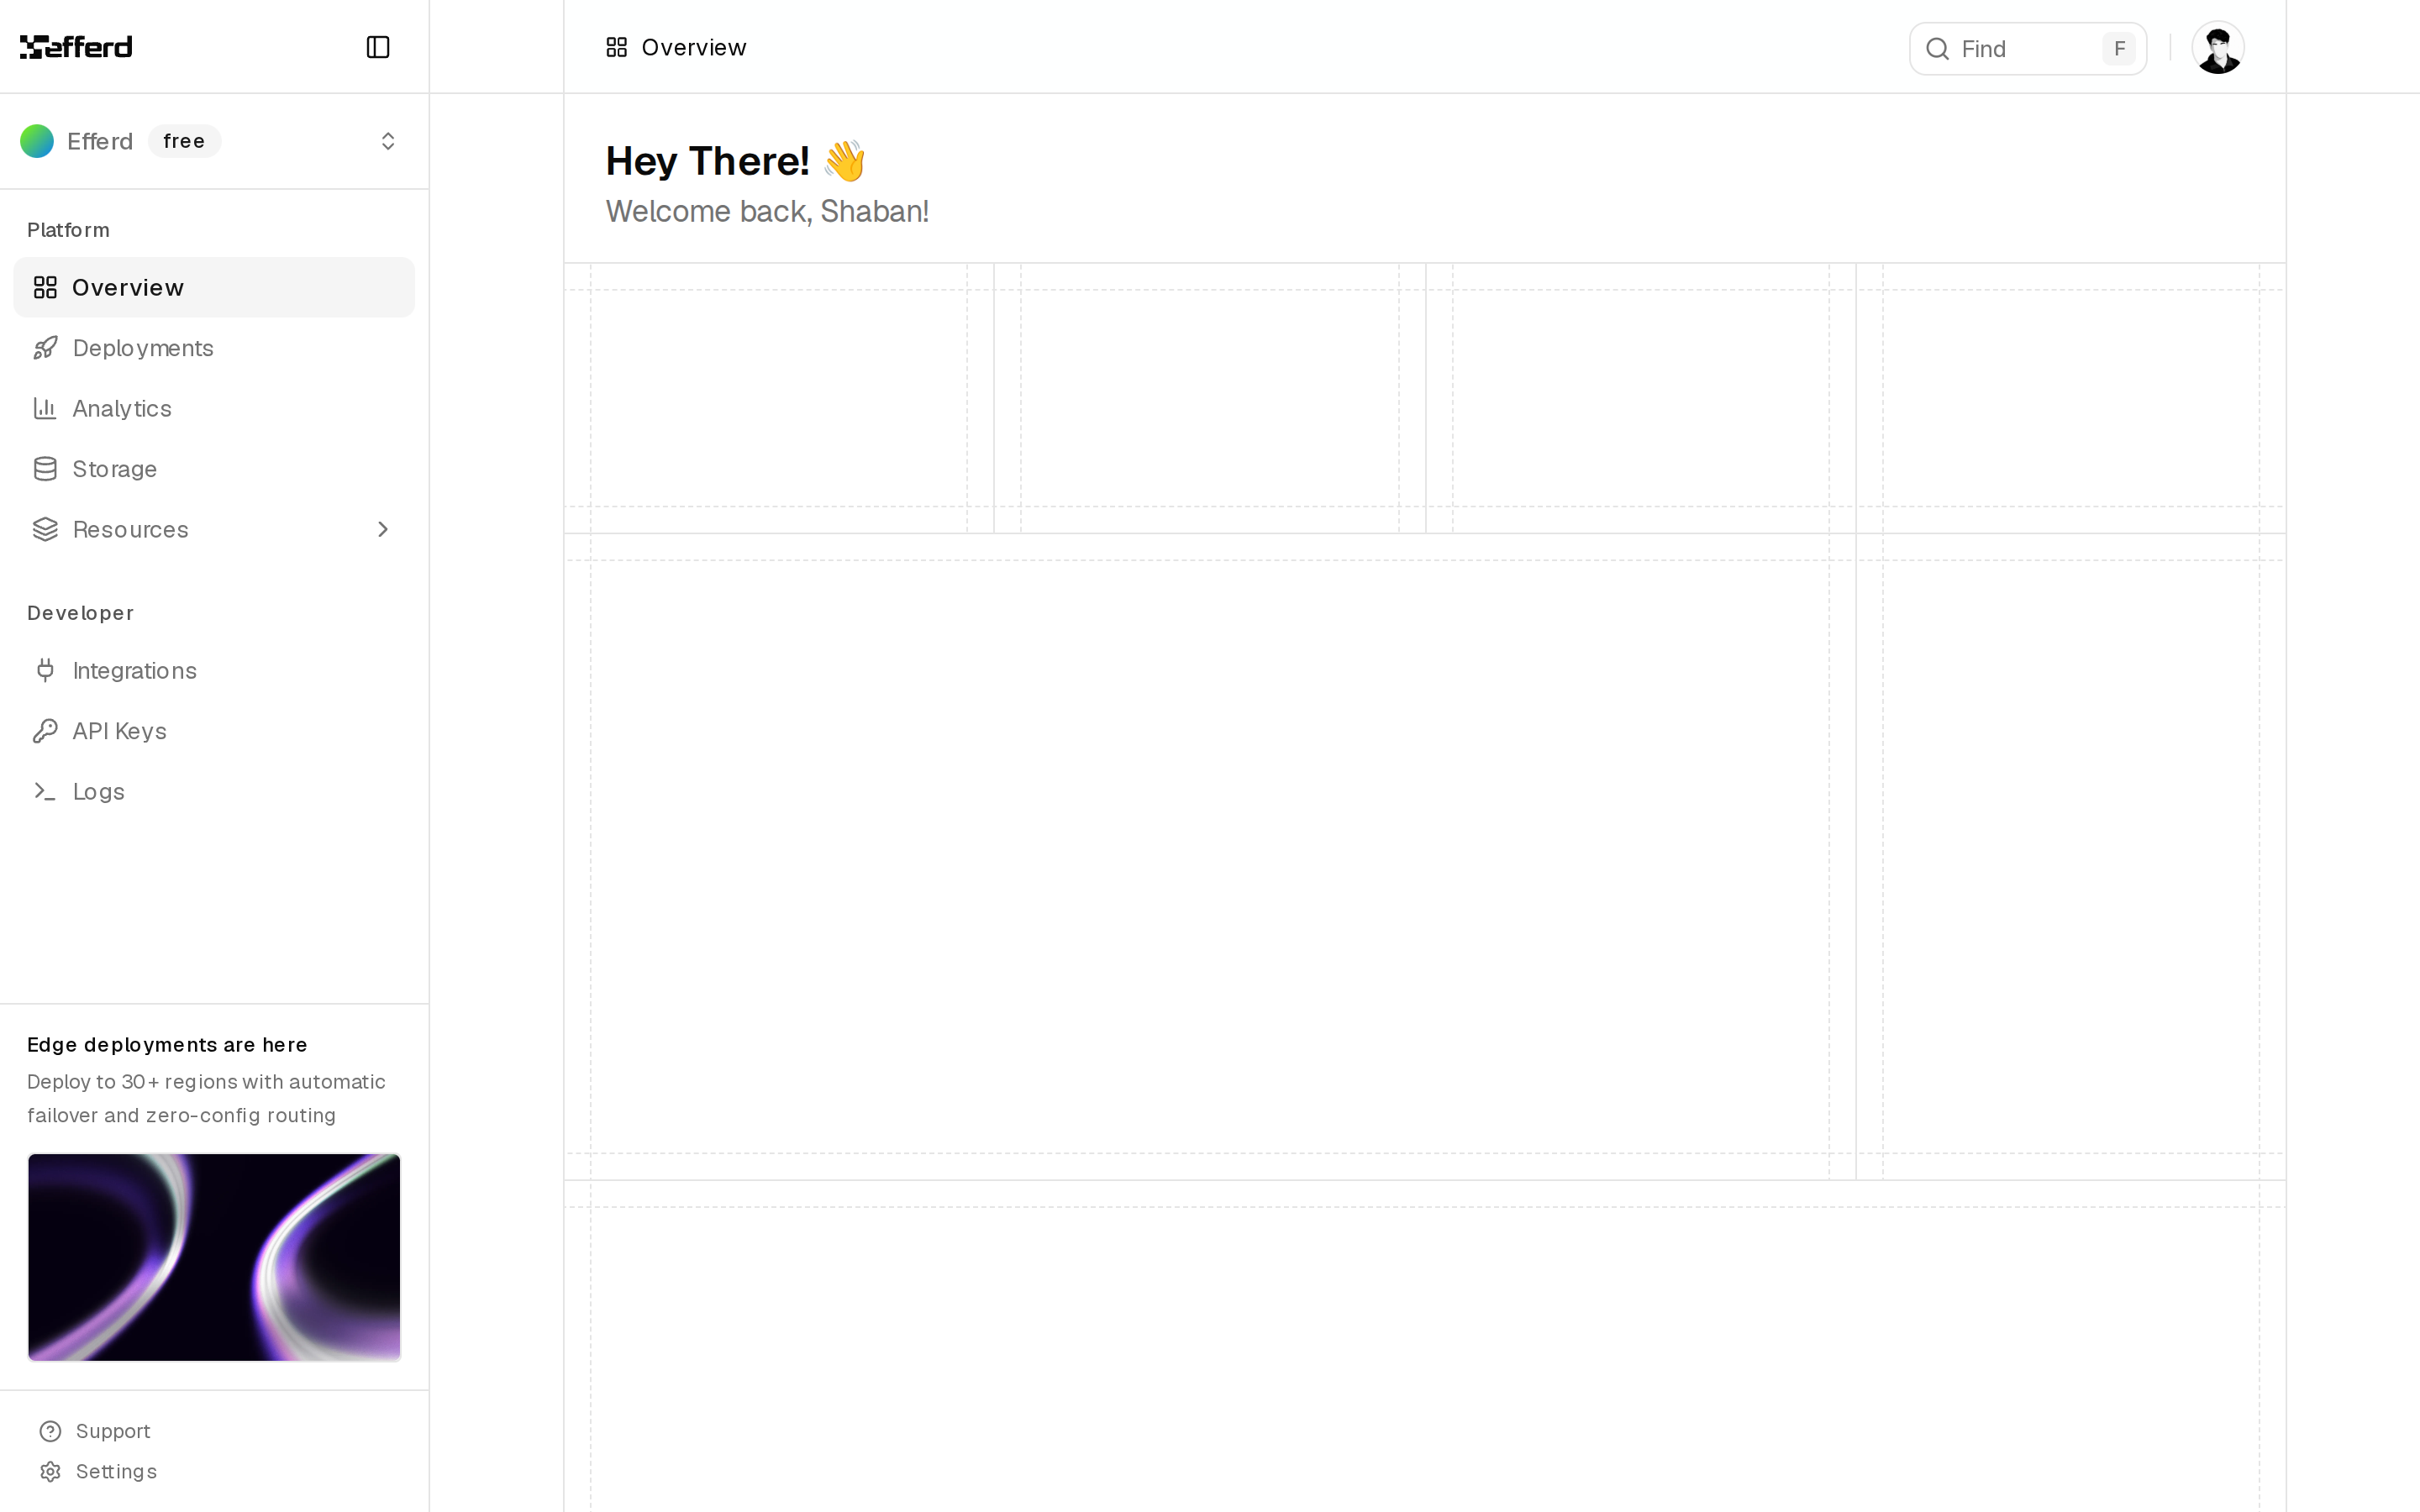
Web analytics dashboard with visitors chart, live users, top pages, traffic sources, and Core Web Vitals.
Web analytics dashboard with visitors chart, live users, top pages, traffic sources, and Core Web Vitals.
"use client";

import {
	Card,
	CardContent,
	CardDescription,
	CardHeader,
	CardTitle,
} from "@/components/ui/card";
import {
	ShareBarList,
	ShareBarListContent,
	ShareBarListFill,
	ShareBarListItem,
	ShareBarListLabel,
	ShareBarListValue,
} from "@/components/share-bar-list";

const segments = [
	{ label: "Returning visitors", share: 54 },
	{ label: "New visitors", share: 41 },
	{ label: "Logged-in users", share: 5 },
] as const;

export function AudienceMix() {
	return (
		<Card className="dark:bg-transparent">
			<CardHeader className="border-b">
				<CardTitle className="text-balance">Audience mix</CardTitle>
				<CardDescription className="text-pretty">
					Session split by familiarity in the last 12 months.
				</CardDescription>
			</CardHeader>
			<CardContent className="p-0 py-1">
				<ShareBarList aria-label="Audience segments by share of sessions">
					{segments.map((row) => (
						<ShareBarListItem key={row.label} value={row.share}>
							<ShareBarListContent>
								<ShareBarListLabel>{row.label}</ShareBarListLabel>
								<ShareBarListValue>{row.share}%</ShareBarListValue>
							</ShareBarListContent>
							<ShareBarListFill />
						</ShareBarListItem>
					))}
				</ShareBarList>
			</CardContent>
		</Card>
	);
}