Generative UI Dashboard
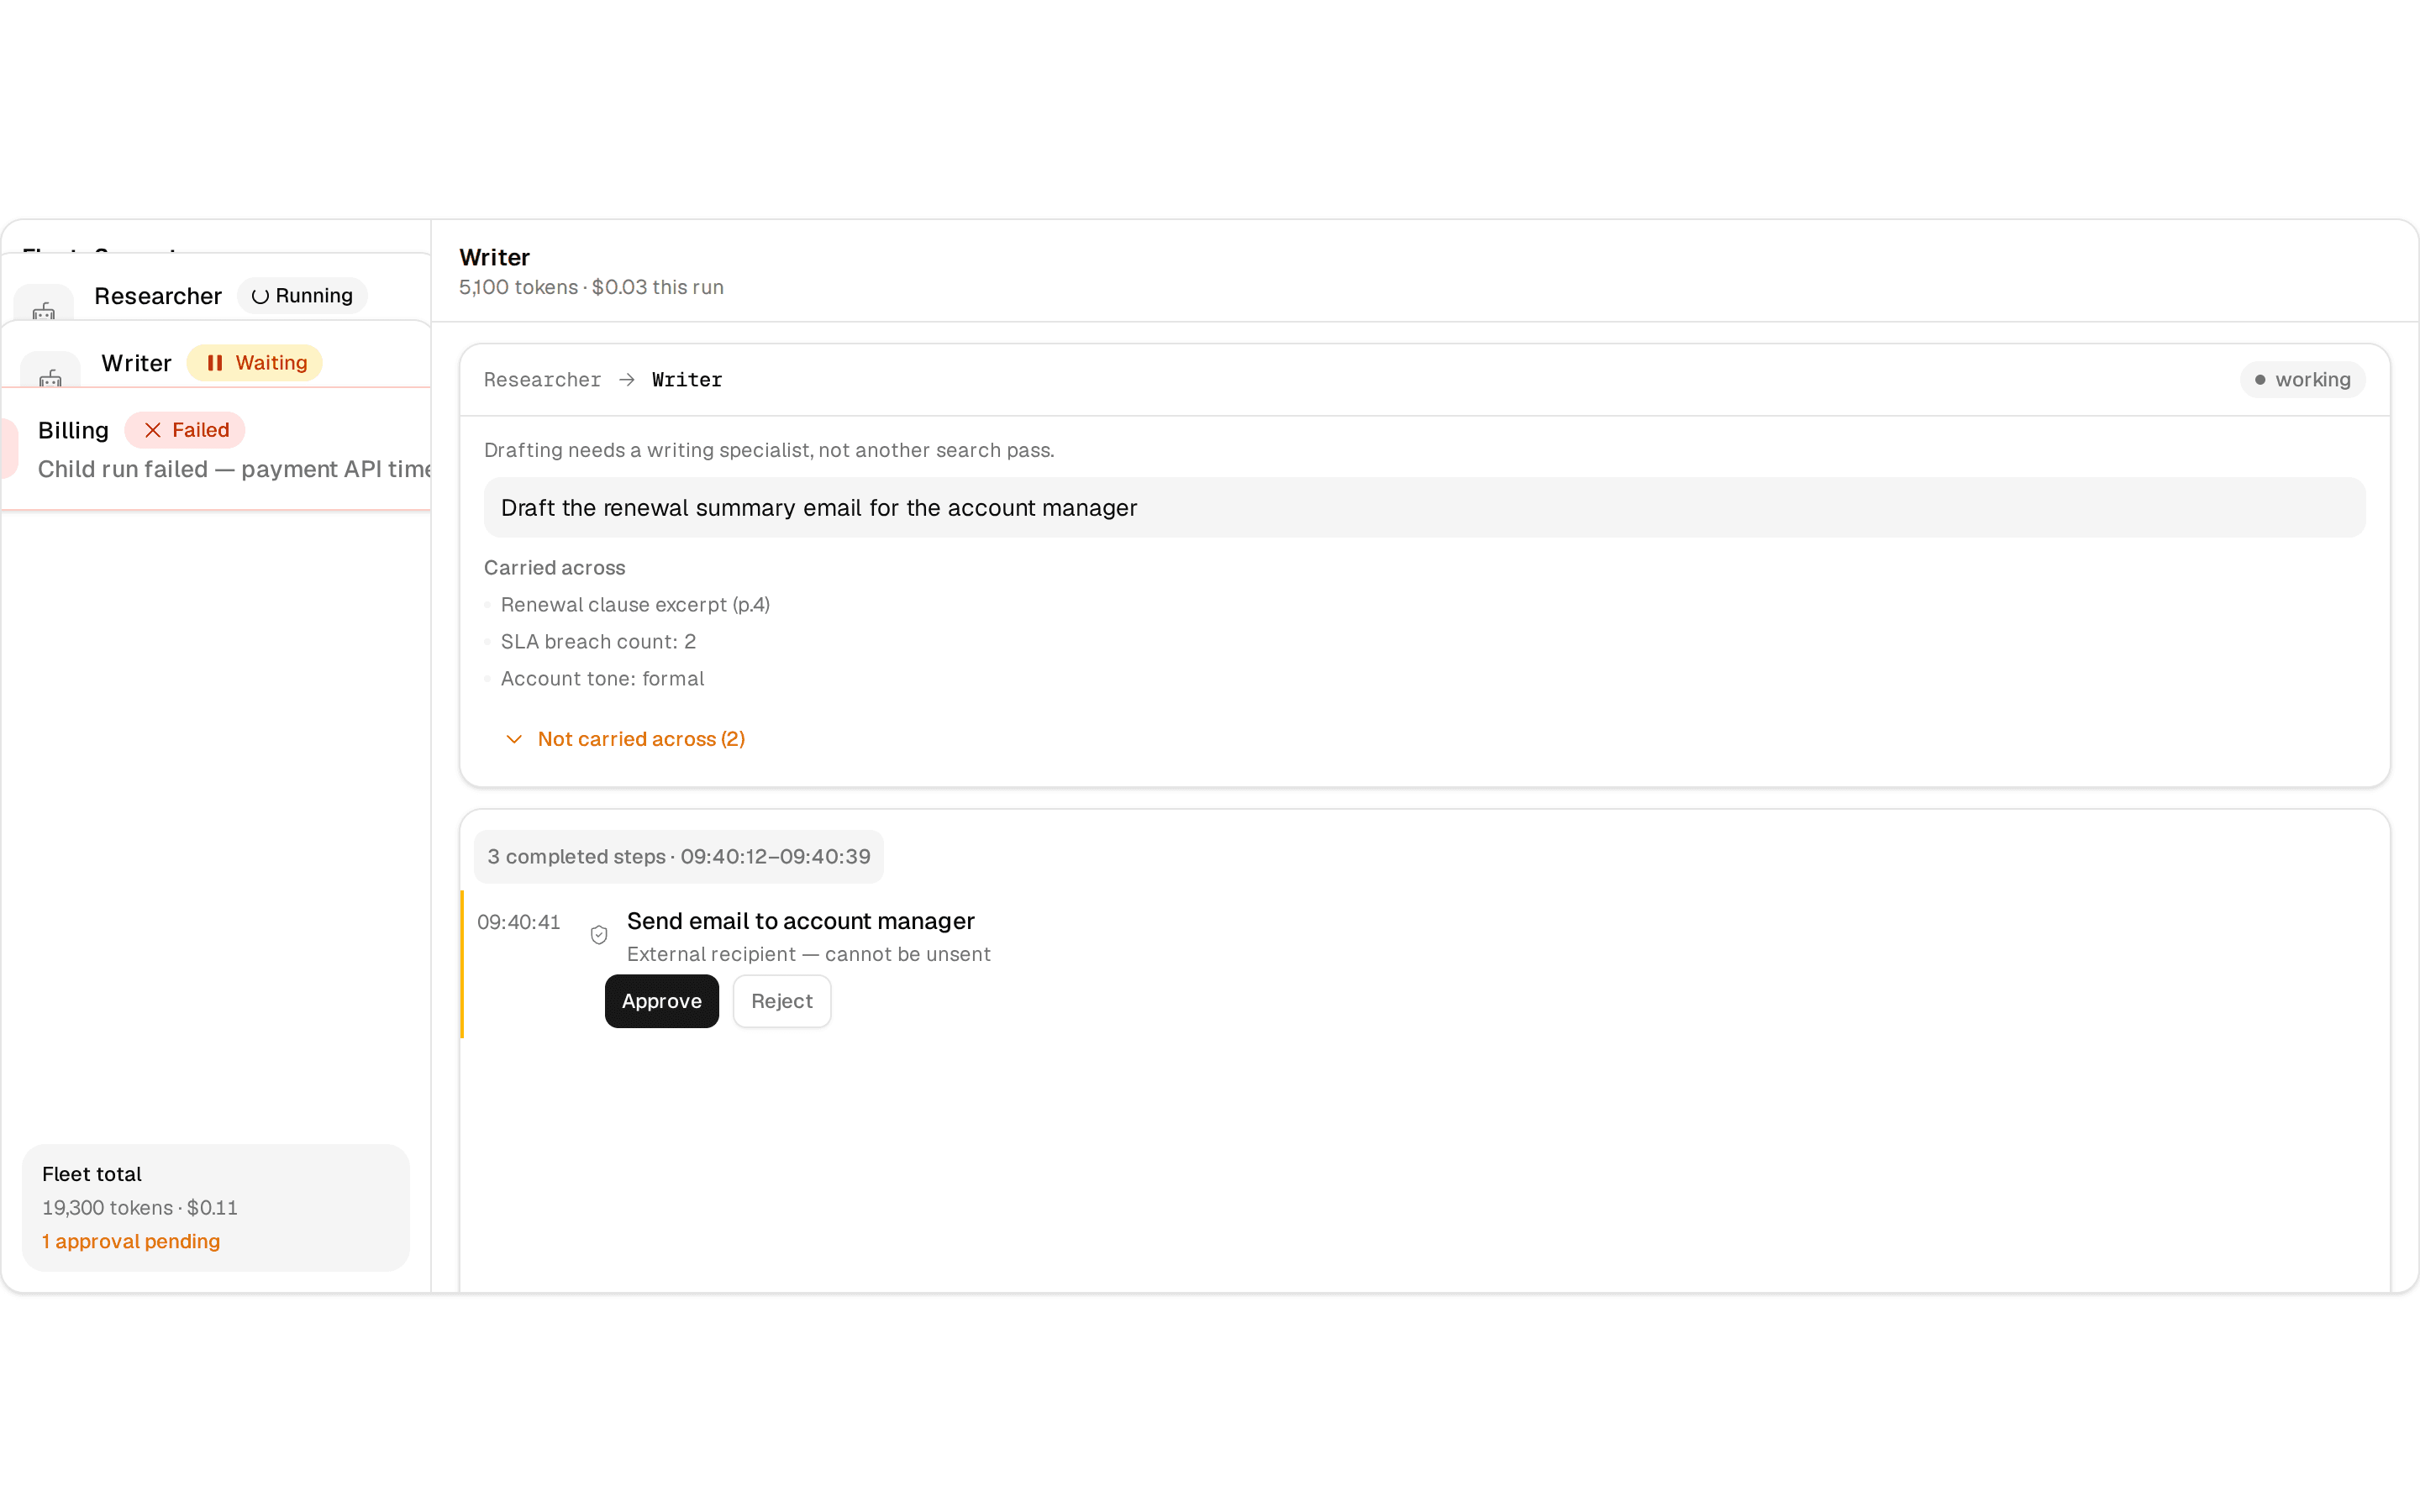
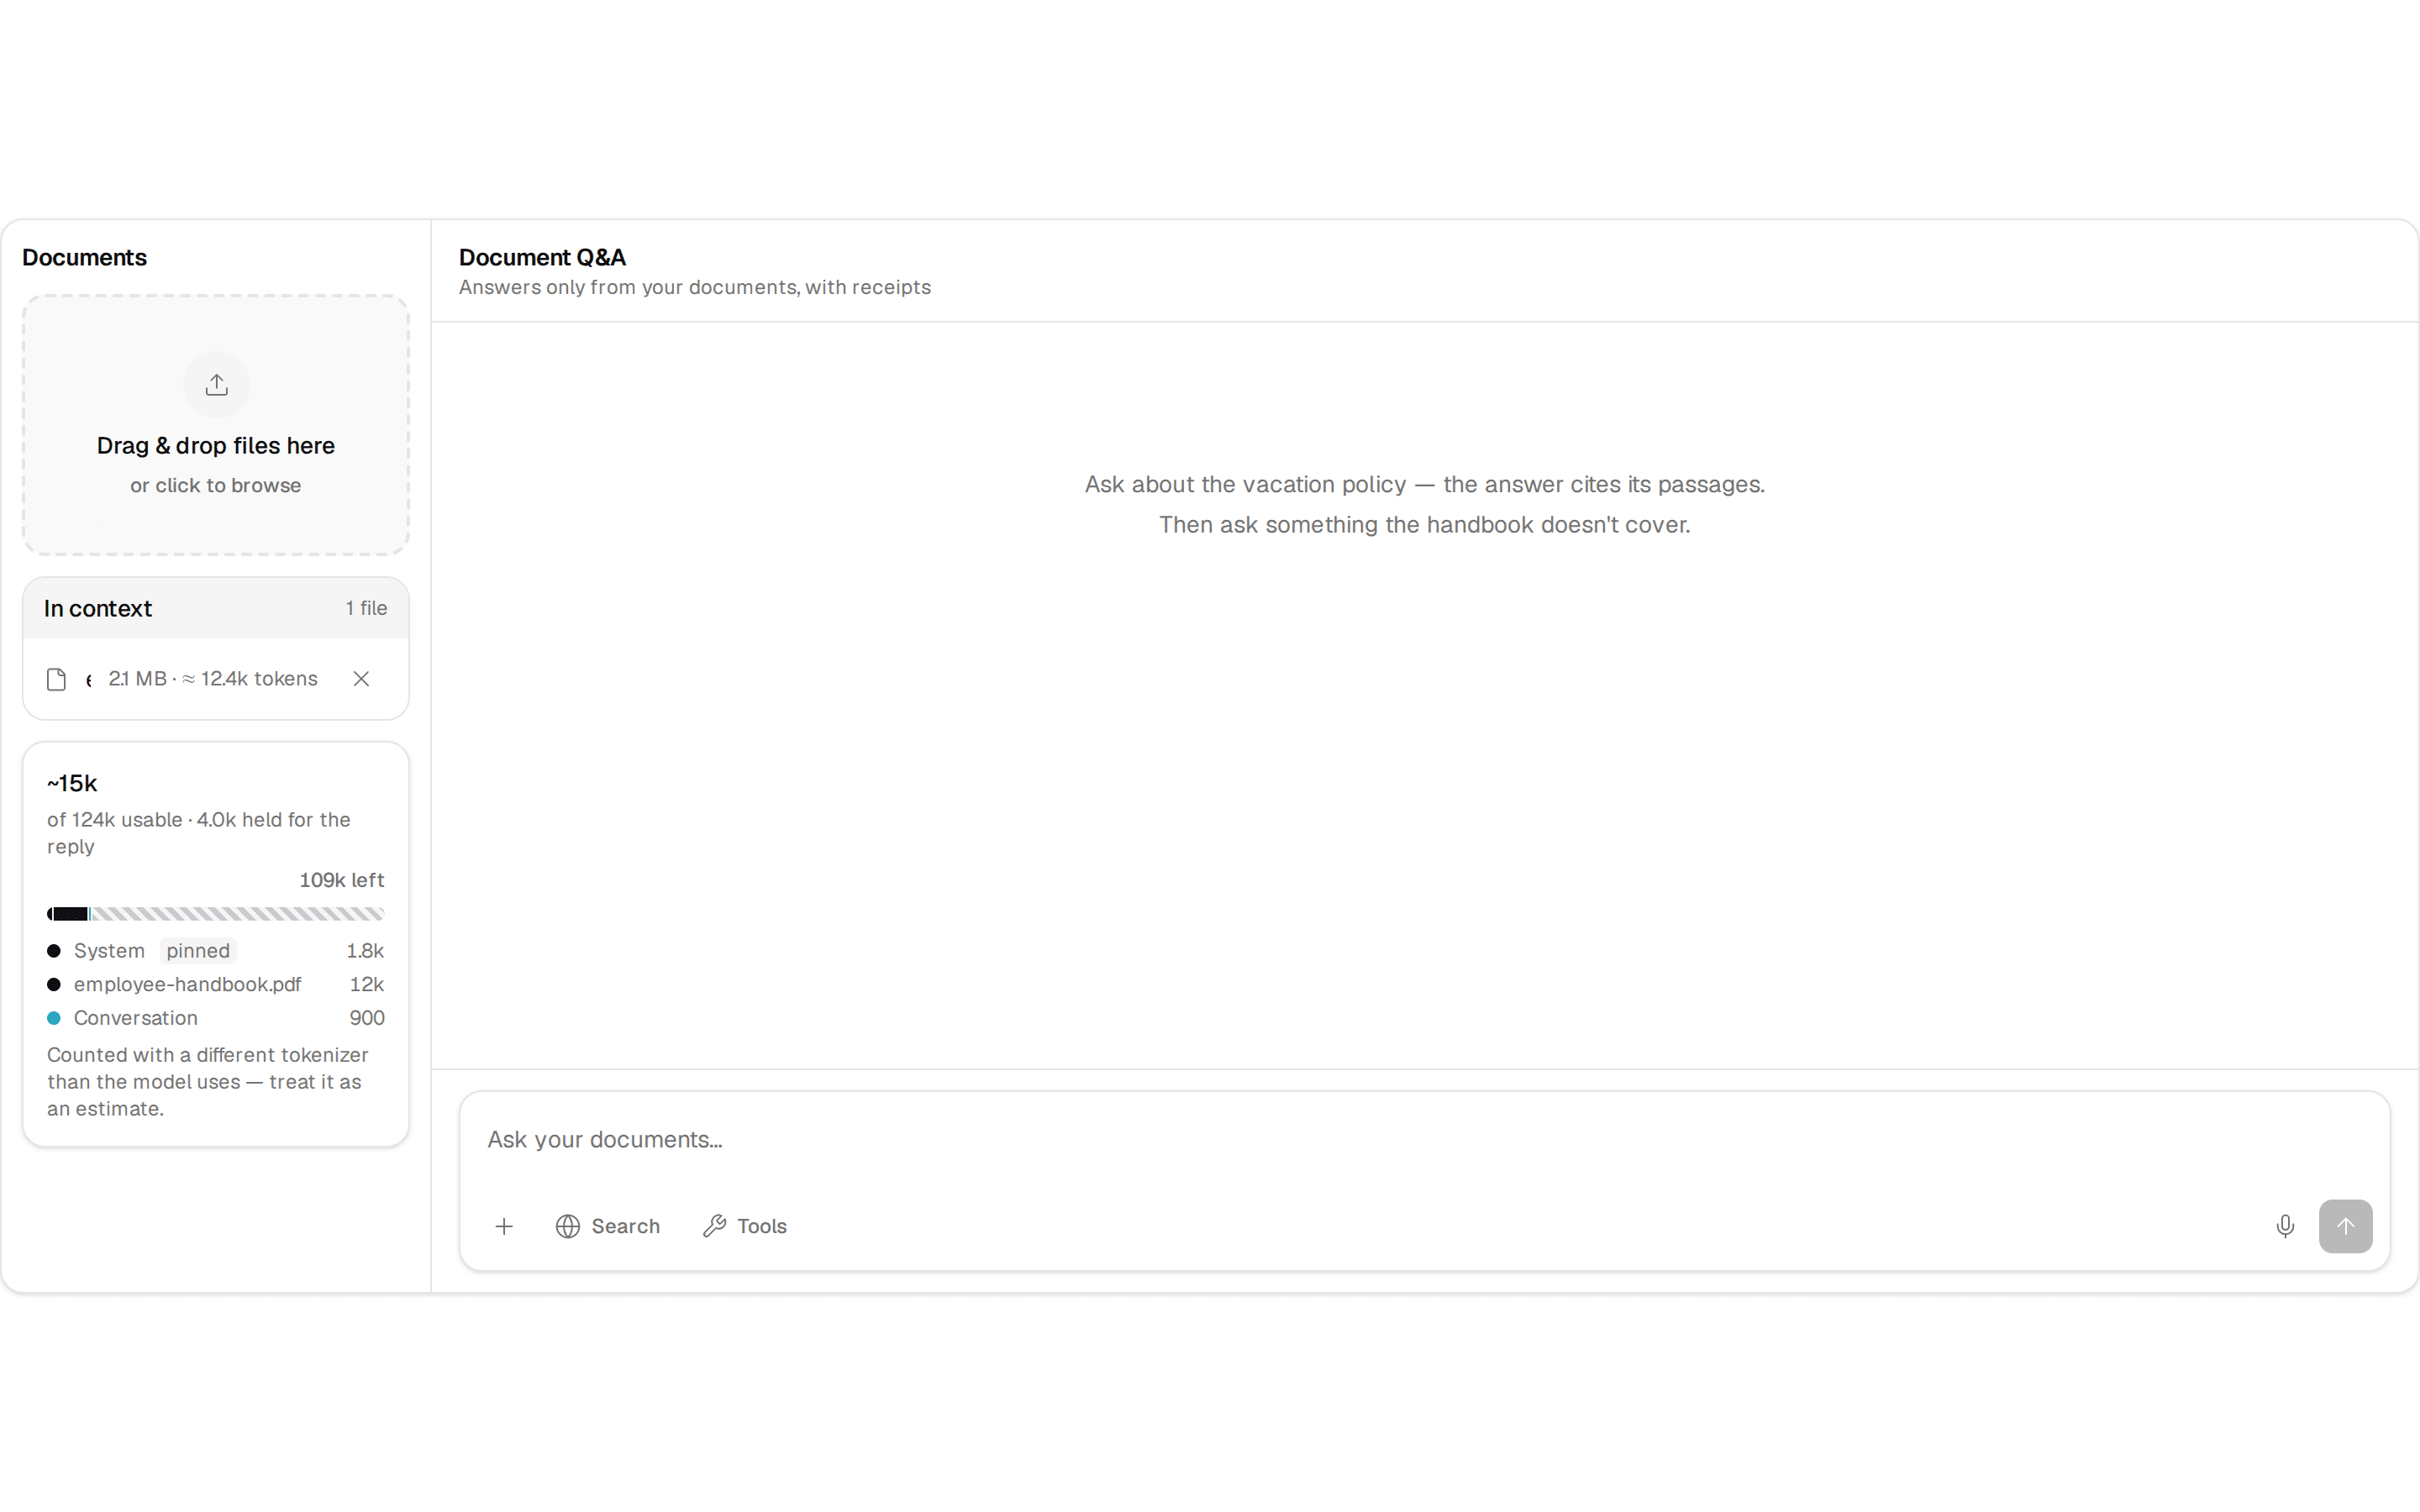
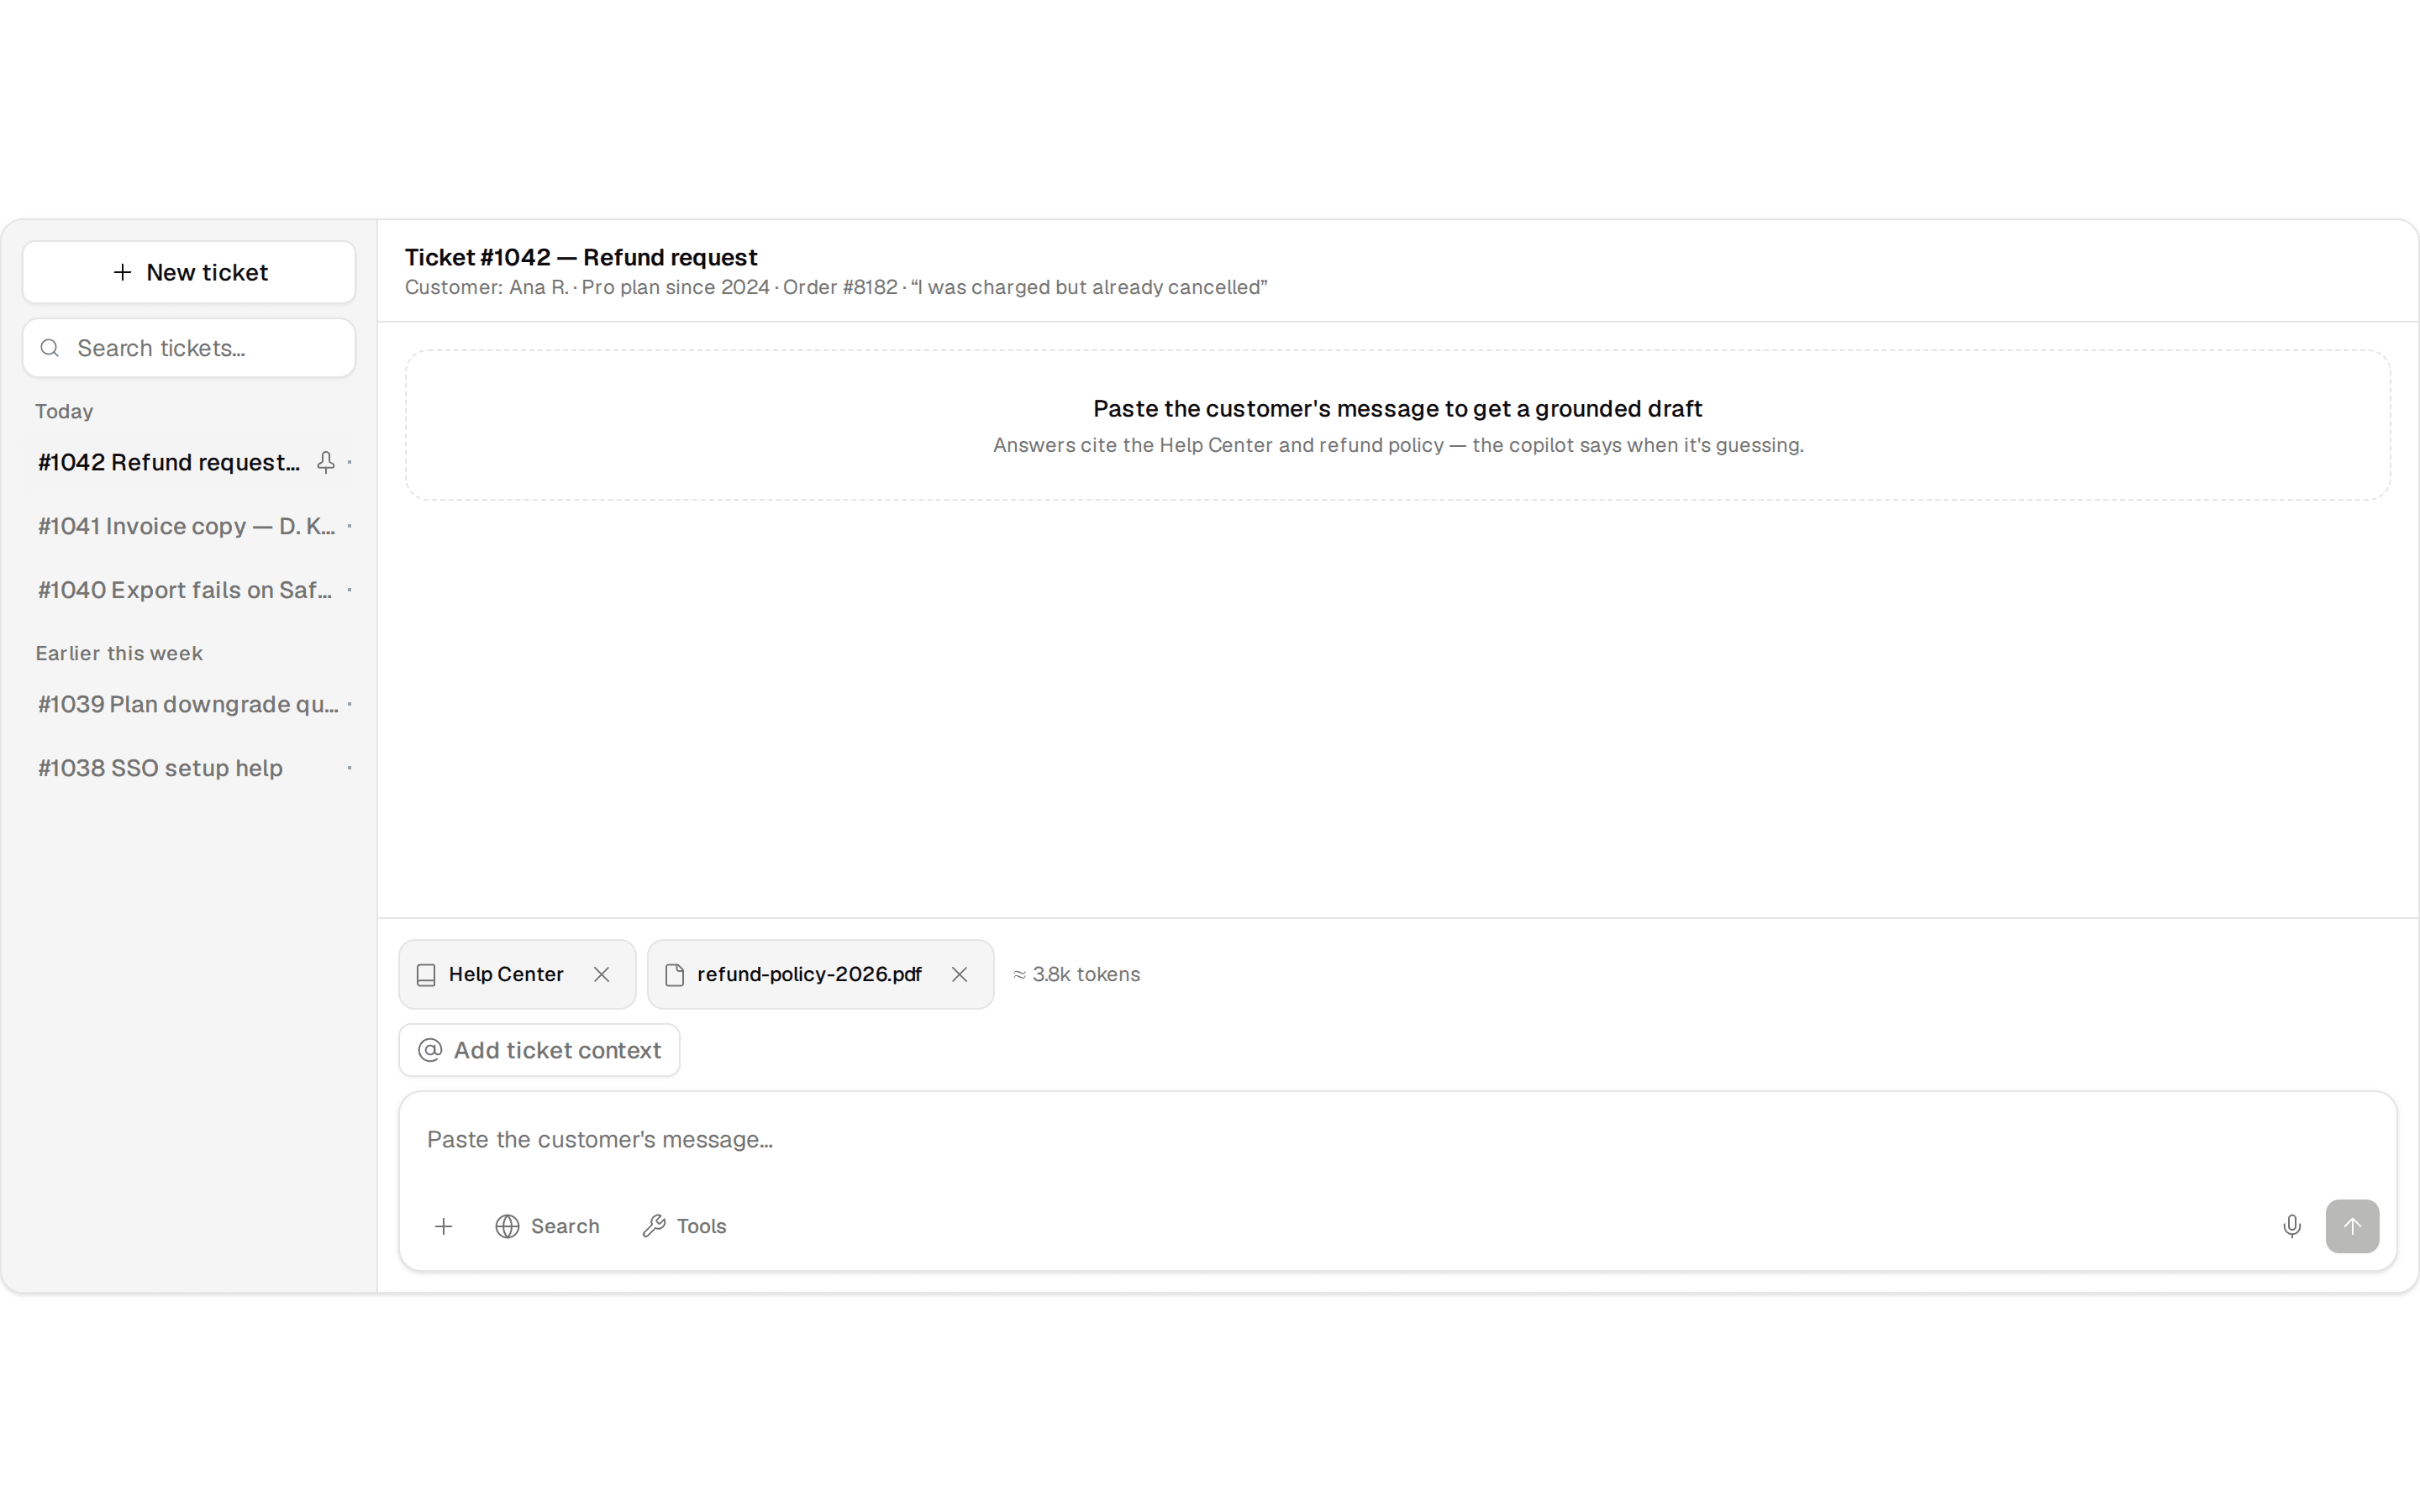
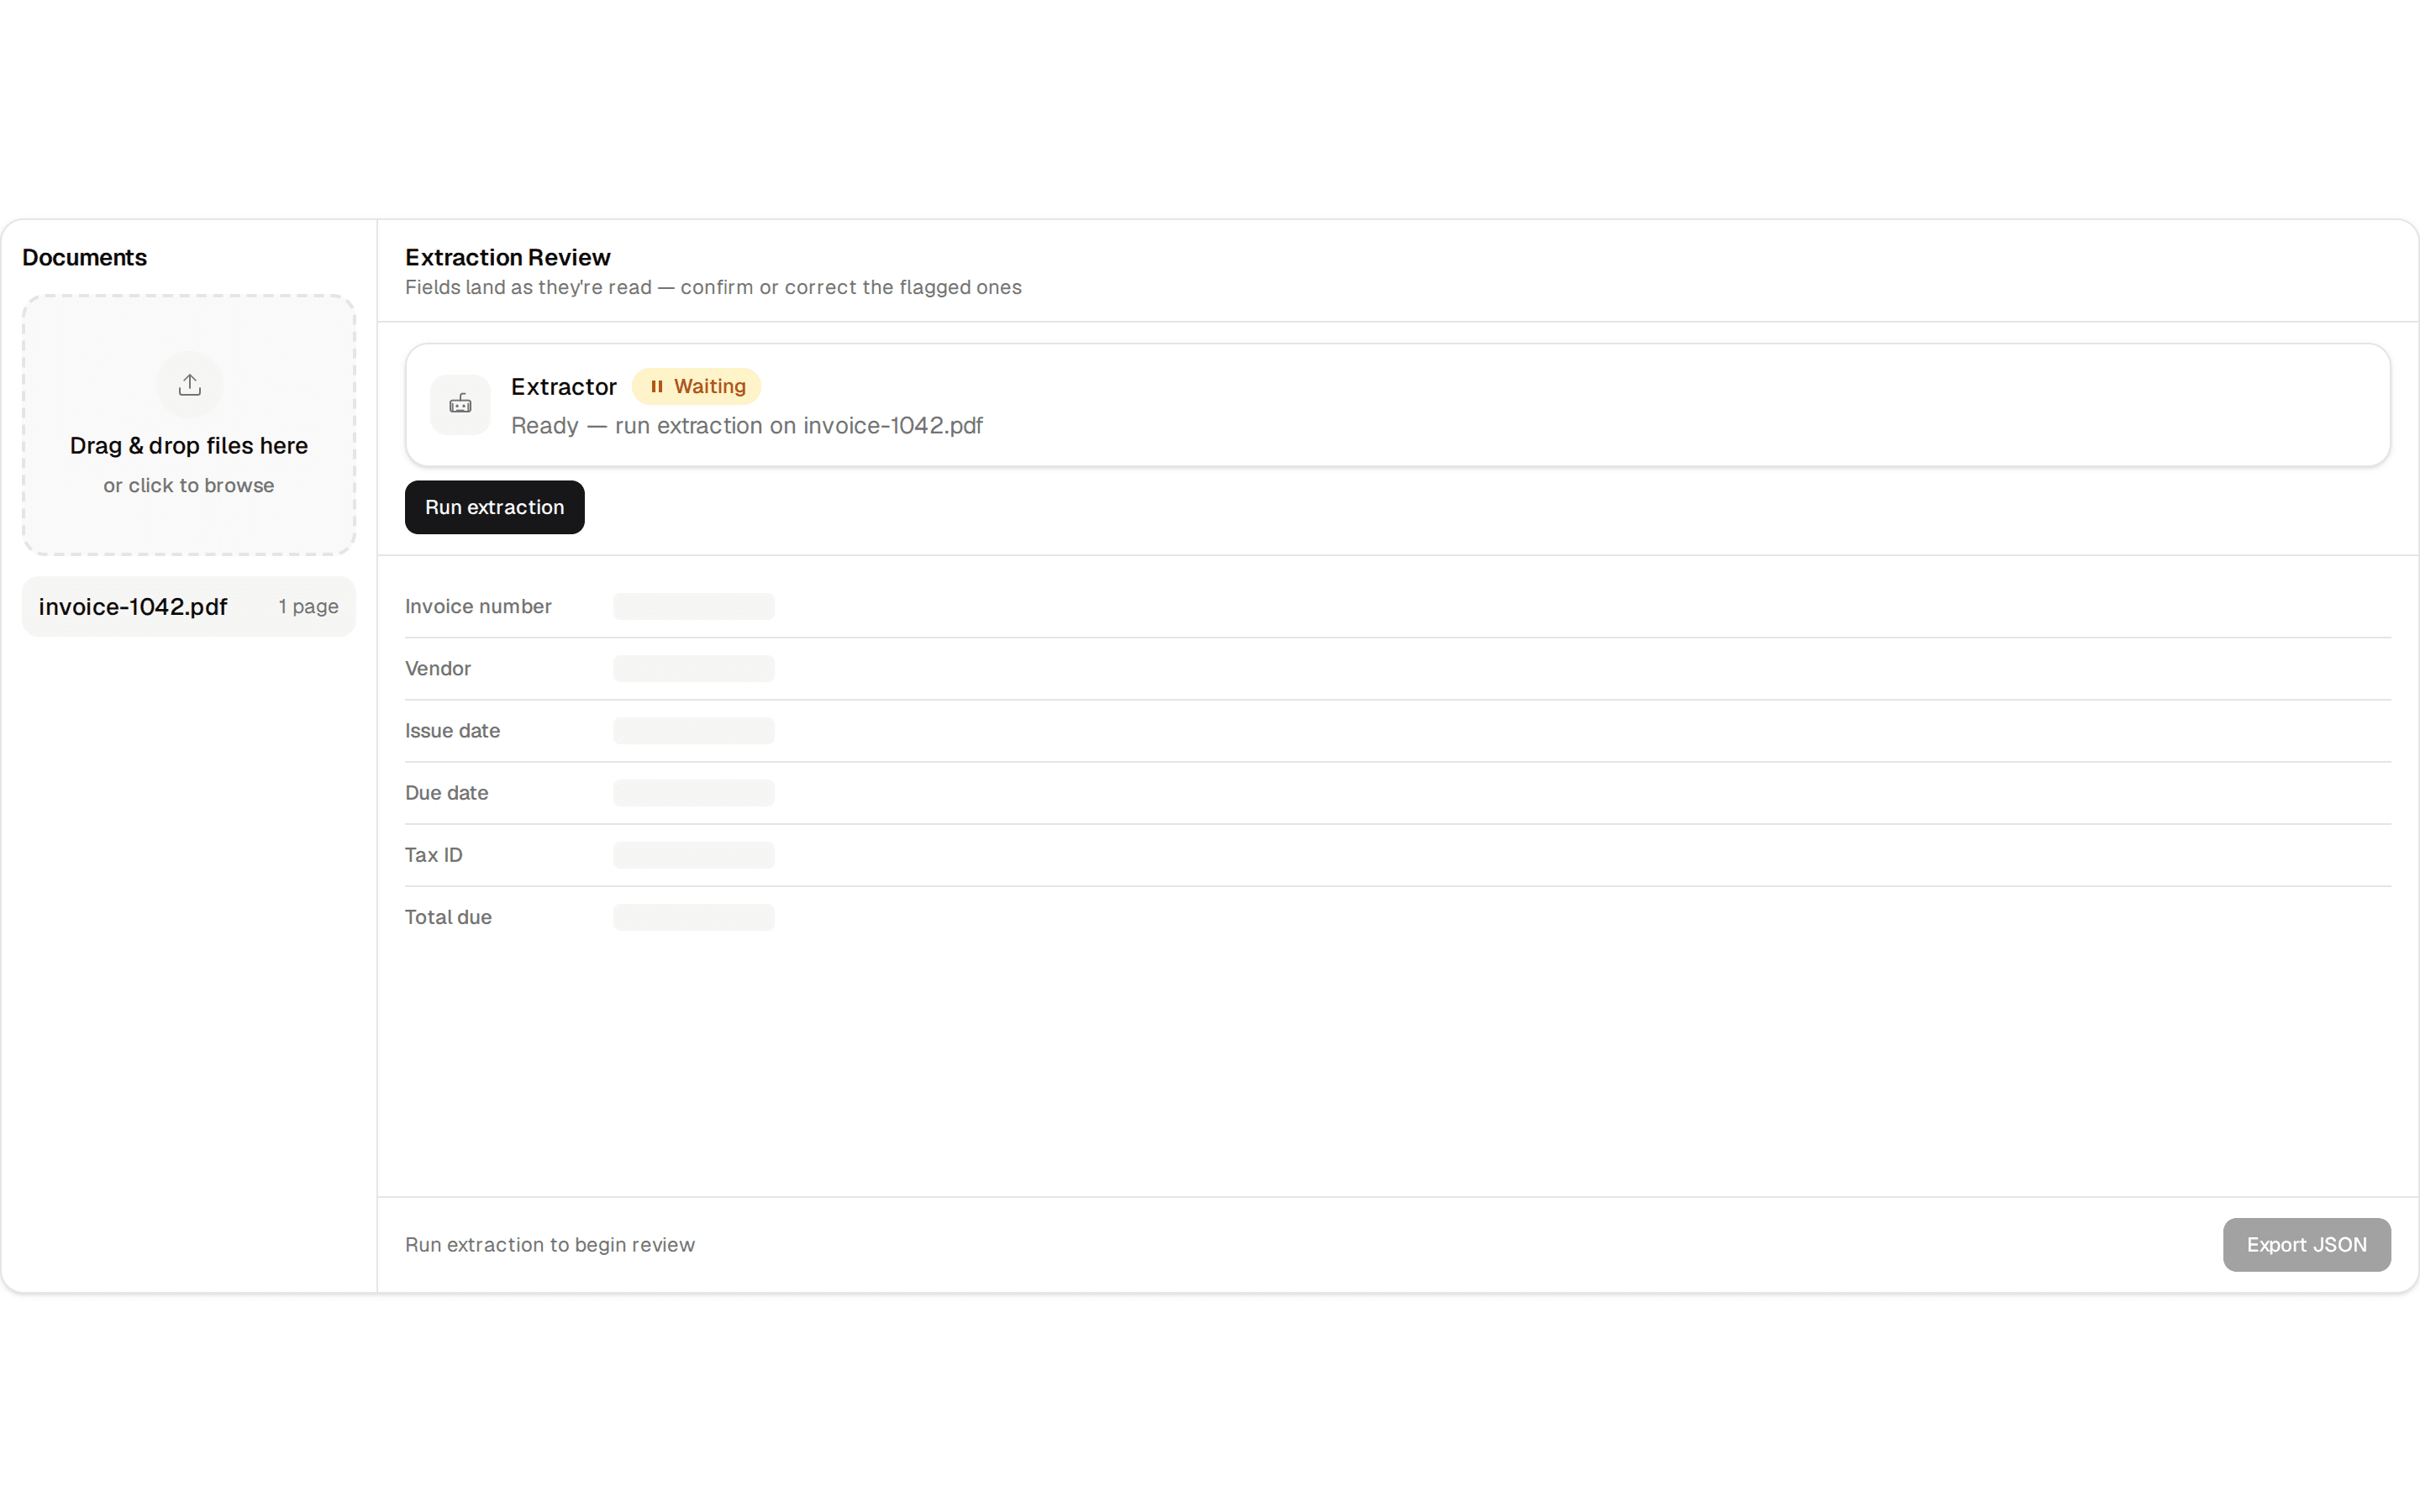
The model assembles a dashboard from a controlled widget registry — streamed props, an unsupported-request fallback, and widget clicks that re-enter the chat.
@scrimui
The model assembles a dashboard from a controlled widget registry — streamed props, an unsupported-request fallback, and widget clicks that re-enter the chat.
@scrimui
src/showcase/patterns/generative-dashboard/generative-dashboard.tsx
"use client";

import { Button } from "@/components/ui/button";
import { Card } from "@/components/ui/card";
import * as React from "react";
import { GenerativeUi } from "@/components/ui/generative-ui";
import { ToolCall } from "@/components/ui/tool-call";
import { ArtifactPreview } from "@/components/ui/artifact-preview";
import { ErrorMessage } from "@/components/ui/error-message";
import { PromptInput } from "@/components/ui/prompt-input";

/**
 * A dashboard the model assembles from a controlled widget registry.
 *
 * What this pattern exists to show:
 *
 * 1. **The model picks from allowed components, never arbitrary UI.** Metric
 *    card, bar chart, data table, report — that is the whole registry, and
 *    every widget is attributed to the tool call that produced it.
 * 2. **Props stream into a shaped skeleton.** The layout is known before the
 *    data is, so nothing resizes when the numbers arrive.
 * 3. **An unsupported request degrades to prose, not a crash.** The model
 *    asked for a 3D scatter; the registry said no, and the raw result is
 *    still behind the Data toggle.
 * 4. **Widget interaction is conversation.** Clicking a bar sends the filter
 *    back into the chat as a message — the model answers it there.
 * 5. **One broken widget is one broken card.** The table failed on a bad
 *    field name; the other widgets never blinked, and Retry fixes just it.
 */

/* ------------------------------------------------------------------ */
/* Mock data                                                           */
/* ------------------------------------------------------------------ */

const REGIONS = [
  { label: "West", value: 412 },
  { label: "East", value: 368 },
  { label: "North", value: 295 },
  { label: "South", value: 231 },
];

const METRICS = [
  { label: "Q3 revenue", value: "$1.31M", delta: "+11% vs Q2" },
  { label: "Deals closed", value: "184", delta: "+9%" },
  { label: "Avg deal size", value: "$7.1k", delta: "+2%" },
];

const WEEKS = [
  { week: "Jul 6", revenue: "$148k", deals: 21 },
  { week: "Jul 13", revenue: "$162k", deals: 24 },
  { week: "Jul 20", revenue: "$141k", deals: 19 },
  { week: "Jul 27", revenue: "$176k", deals: 26 },
];

const REPORT_MD = `# Q3 revenue summary

West leads at $412k (+8% vs Q2), East close behind at $368k.
North recovered after a slow July; South is flat.

Recommended: shift two East reps to the South pipeline review.`;

const SCATTER_JSON = `{
  "requested": "scatter_3d",
  "registry": ["metric_card", "bar_chart", "data_table", "report"],
  "result": { "points": 184, "axes": ["deal_size", "cycle_days", "region"] }
}`;

/* ------------------------------------------------------------------ */
/* Registry widgets — the only components the model may render          */
/* ------------------------------------------------------------------ */

function MetricCard({ label, value, delta }: { label: string; value: string; delta: string }) {
  return (
    <div className="px-4 py-3">
      <p className="text-xs text-muted-foreground">{label}</p>
      <p className="mt-0.5 text-xl font-semibold tabular-nums text-foreground">{value}</p>
      <p className="text-xs font-medium text-teal-600 dark:text-teal-400">{delta}</p>
    </div>
  );
}

function BarChart({ onPick }: { onPick?: (region: string) => void }) {
  const max = Math.max(...REGIONS.map((r) => r.value));
  return (
    <div className="space-y-2 px-4 py-3">
      <p className="text-xs font-medium text-muted-foreground">Revenue by region — click a bar to filter</p>
      {REGIONS.map((r) => (
        <Button variant="ghost" size="sm"
          key={r.label}
          type="button"
          onClick={() => onPick?.(r.label)}
          className="h-auto min-h-8 whitespace-normal justify-start group flex w-full items-center gap-2 text-left"
          aria-label={`Filter to ${r.label}, $${r.value}k`}
        >
          <span className="w-10 text-xs text-muted-foreground">{r.label}</span>
          <span className="h-4 rounded bg-muted transition-colors group-hover:bg-muted" style={{ width: `${(r.value / max) * 70}%` }} />
          <span className="text-xs tabular-nums text-muted-foreground">${r.value}k</span>
        </Button>
      ))}
    </div>
  );
}

function DataTable() {
  return (
    <table className="w-full text-sm">
      <thead>
        <tr className="border-b border-border text-left text-xs text-muted-foreground">
          <th className="px-4 py-2 font-medium">Week</th>
          <th className="px-4 py-2 font-medium">Revenue</th>
          <th className="px-4 py-2 font-medium">Deals</th>
        </tr>
      </thead>
      <tbody>
        {WEEKS.map((w) => (
          <tr key={w.week} className="border-b border-border last:border-0">
            <td className="px-4 py-2 text-foreground">{w.week}</td>
            <td className="px-4 py-2 tabular-nums text-foreground">{w.revenue}</td>
            <td className="px-4 py-2 tabular-nums text-foreground">{w.deals}</td>
          </tr>
        ))}
      </tbody>
    </table>
  );
}

function ReportBody() {
  return (
    <div className="space-y-2 px-4 py-3 text-sm leading-6 text-foreground">
      <p>West leads at <strong className="text-foreground">$412k</strong> (+8% vs Q2), East close behind at $368k.</p>
      <p>North recovered after a slow July; South is flat. Recommended: shift two East reps to the South pipeline review.</p>
    </div>
  );
}

/* ------------------------------------------------------------------ */
/* Types                                                               */
/* ------------------------------------------------------------------ */

type ChatItem =
  | { id: string; kind: "user" | "assistant"; text: string }
  | { id: string; kind: "tool"; name: string; input: string; output?: string; status: "running" | "success"; duration?: string };

type Widget = {
  id: string;
  tool: string;
  type: "metric" | "chart" | "table" | "report" | "unsupported";
  state: "streaming" | "ready" | "error";
  metricIndex?: number;
};

/* ------------------------------------------------------------------ */
/* Pattern                                                             */
/* ------------------------------------------------------------------ */

export function GenerativeDashboardPattern() {
  const [chat, setChat] = React.useState<ChatItem[]>([]);
  const [widgets, setWidgets] = React.useState<Widget[]>([]);
  const [submits, setSubmits] = React.useState(0);
  const [busy, setBusy] = React.useState(false);
  const [filtered, setFiltered] = React.useState<string | null>(null);
  const [retrying, setRetrying] = React.useState(false);

  const timers = React.useRef<number[]>([]);
  React.useEffect(() => {
    const t = timers.current;
    return () => t.forEach(clearTimeout);
  }, []);
  function later(ms: number, fn: () => void) {
    timers.current.push(window.setTimeout(fn, ms));
  }

  function push(...items: ChatItem[]) {
    setChat((c) => [...c, ...items]);
  }

  function setWidgetState(id: string, state: Widget["state"]) {
    setWidgets((ws) => ws.map((w) => (w.id === id ? { ...w, state } : w)));
  }

  function submit(text: string) {
    if (busy) return;
    const n = submits + 1;
    setSubmits(n);
    setBusy(true);
    push({ id: `u${n}`, kind: "user", text });

    if (n === 1) {
      push({ id: "t1", kind: "tool", name: "query_metrics", input: '{ metric: "revenue", by: "region", quarter: "Q3" }', status: "running" });
      later(1000, () => {
        setChat((c) =>
          c.map((item) =>
            item.id === "t1" && item.kind === "tool"
              ? { ...item, status: "success", output: '{ regions: 4, total: "$1.31M" }', duration: "0.8s" }
              : item,
          ),
        );
        push({ id: "a1", kind: "assistant", text: "Q3 revenue is $1.31M, up 11% on Q2. West leads — I put the breakdown on the canvas, plus a written summary you can copy out." });
        setWidgets([
          { id: "m0", tool: "query_metrics", type: "metric", state: "streaming", metricIndex: 0 },
          { id: "m1", tool: "query_metrics", type: "metric", state: "streaming", metricIndex: 1 },
          { id: "m2", tool: "query_metrics", type: "metric", state: "streaming", metricIndex: 2 },
          { id: "c1", tool: "query_metrics", type: "chart", state: "streaming" },
          { id: "r1", tool: "write_report", type: "report", state: "streaming" },
        ]);
      });
      later(1700, () => ["m0", "m1", "m2"].forEach((id) => setWidgetState(id, "ready")));
      later(2200, () => {
        setWidgetState("c1", "ready");
        setWidgetState("r1", "ready");
        setBusy(false);
      });
    } else if (n === 2) {
      later(700, () => {
        push({
          id: "a2",
          kind: "assistant",
          text: "I can't render that one: a 3D scatter isn't in this dashboard's registry, so I won't fake it. The raw result is below — the deal-size vs cycle-days view works as a table if you want it.",
        });
        setWidgets((ws) => [...ws, { id: "x1", tool: "render_widget", type: "unsupported", state: "ready" }]);
        setBusy(false);
      });
    } else if (n === 3) {
      setWidgets((ws) => [...ws, { id: "tb1", tool: "weekly_breakdown", type: "table", state: "streaming" }]);
      later(1100, () => {
        setWidgetState("tb1", "error");
        push({ id: "a3", kind: "assistant", text: "The weekly table failed to render — the tool returned the data under a field the widget didn't expect. Retry it; nothing else on the canvas is affected." });
        setBusy(false);
      });
    } else {
      later(600, () => {
        push({ id: `a${n}`, kind: "assistant", text: "Nothing new to add — the canvas already covers revenue by region, the weekly breakdown and the summary report. Ask for a different cut if you want another widget." });
        setBusy(false);
      });
    }
  }

  function retryTable() {
    setRetrying(true);
    setWidgetState("tb1", "streaming");
    later(1400, () => {
      setWidgetState("tb1", "ready");
      setRetrying(false);
      push({ id: "a3r", kind: "assistant", text: "Fixed — the weekly breakdown is on the canvas now. July 27 was the strongest week at $176k across 26 deals." });
    });
  }

  function pickRegion(region: string) {
    if (filtered === region || busy) return;
    setFiltered(region);
    push({ id: `uf-${region}`, kind: "user", text: `Filter: ${region}` });
    later(700, () => {
      push({
        id: `af-${region}`,
        kind: "assistant",
        text: `Filtered to ${region}: $412k revenue, up 8% vs Q2, with the shortest sales cycle of any region at 23 days.`,
      });
    });
  }

  return (
    <Card className="flex-row gap-0 py-0 flex h-[640px] overflow-hidden rounded-xl border border-border bg-card">
      {/* Conversation drives the canvas */}
      <div className="flex w-[320px] shrink-0 flex-col border-r border-border max-md:w-full">
        <div className="border-b border-border px-4 py-3">
          <p className="text-sm font-semibold text-foreground">Analytics copilot</p>
          <p className="text-xs text-muted-foreground">Registry: metric card · bar chart · data table · report</p>
        </div>

        <div className="flex-1 space-y-3 overflow-y-auto px-3 py-3">
          {chat.length === 0 && (
            <div className="rounded-xl border border-dashed border-border px-3 py-5 text-center">
              <p className="text-sm font-medium text-foreground">Ask for a number, get a dashboard</p>
              <p className="mt-1 text-xs text-muted-foreground">
                Try: “Revenue by region for Q3”, then “Show a 3D scatter of reps”, then “Break it down by week”.
              </p>
            </div>
          )}
          {chat.map((item) =>
            item.kind === "user" ? (
              <div key={item.id} className="flex justify-end">
                <p className="max-w-[90%] rounded-xl rounded-br-md bg-primary px-3.5 py-2 text-sm leading-6 text-primary-foreground">
                  {item.text}
                </p>
              </div>
            ) : item.kind === "tool" ? (
              <ToolCall key={item.id} name={item.name} input={item.input} output={item.output} status={item.status} duration={item.duration} />
            ) : (
              <p key={item.id} className="rounded-xl border border-border bg-card px-3.5 py-2 text-sm leading-6 text-foreground">
                {item.text}
              </p>
            ),
          )}
        </div>

        <div className="border-t border-border p-3">
          <PromptInput onSubmit={submit} placeholder="Ask for a metric…" loading={busy} />
        </div>
      </div>

      {/* Canvas — only registry widgets may appear here */}
      <div className="flex-1 overflow-y-auto bg-muted p-4 max-md:hidden">
        {widgets.length === 0 ? (
          <div className="flex h-full items-center justify-center">
            <p className="text-sm text-muted-foreground">The canvas is empty — widgets land here as the model renders them.</p>
          </div>
        ) : (
          <div className="grid grid-cols-2 gap-3 lg:grid-cols-3">
            {widgets.map((w) =>
              w.type === "metric" ? (
                <GenerativeUi
                  key={w.id}
                  tool={w.tool}
                  state={w.state === "ready" ? "ready" : "streaming"}
                  skeleton={
                    <div className="space-y-2 px-4 py-3">
                      <div className="h-3 w-20 animate-pulse rounded bg-muted" />
                      <div className="h-6 w-24 animate-pulse rounded bg-muted" />
                      <div className="h-3 w-14 animate-pulse rounded bg-muted" />
                    </div>
                  }
                >
                  <MetricCard {...METRICS[w.metricIndex ?? 0]} />
                </GenerativeUi>
              ) : w.type === "chart" ? (
                <div key={w.id} className="col-span-2">
                  <GenerativeUi
                    tool={w.tool}
                    state={w.state === "ready" ? "ready" : "streaming"}
                    skeleton={
                      <div className="space-y-2.5 px-4 py-3">
                        {[70, 62, 50, 38].map((pct) => (
                          <div key={pct} className="h-4 animate-pulse rounded bg-muted" style={{ width: `${pct}%` }} />
                        ))}
                      </div>
                    }
                  >
                    <BarChart onPick={pickRegion} />
                  </GenerativeUi>
                </div>
              ) : w.type === "table" ? (
                <div key={w.id} className="col-span-2">
                  <GenerativeUi
                    tool={w.tool}
                    state={w.state === "streaming" ? "streaming" : "ready"}
                    skeleton={
                      <div className="space-y-2 px-4 py-3">
                        {[0, 1, 2, 3].map((i) => (
                          <div key={i} className="h-4 w-full animate-pulse rounded bg-muted" />
                        ))}
                      </div>
                    }
                  >
                    {w.state === "error" ? (
                      <div className="p-3">
                        <ErrorMessage
                          title="Widget failed to render"
                          message="rows is undefined — the tool returned weekly data under `weeks`, not `rows`."
                          onRetry={retryTable}
                          retrying={retrying}
                        />
                      </div>
                    ) : (
                      <DataTable />
                    )}
                  </GenerativeUi>
                </div>
              ) : w.type === "report" ? (
                <div key={w.id} className="col-span-2 lg:col-span-3">
                  <ArtifactPreview
                    title="Q3 revenue summary"
                    type="document"
                    status={w.state === "ready" ? "ready" : "streaming"}
                    preview={<ReportBody />}
                    code={REPORT_MD}
                    language="Markdown"
                  />
                </div>
              ) : (
                <GenerativeUi
                  key={w.id}
                  tool={w.tool}
                  state="unsupported"
                  fallback={
                    <span>
                      The registry has no <code className="rounded bg-muted px-1">scatter_3d</code> widget — the model
                      asked for one anyway. Refused, not improvised: the raw result is under Data.
                    </span>
                  }
                  data={SCATTER_JSON}
                />
              ),
            )}
          </div>
        )}
      </div>
    </Card>
  );
}