Stats 1: headline metrics with trends
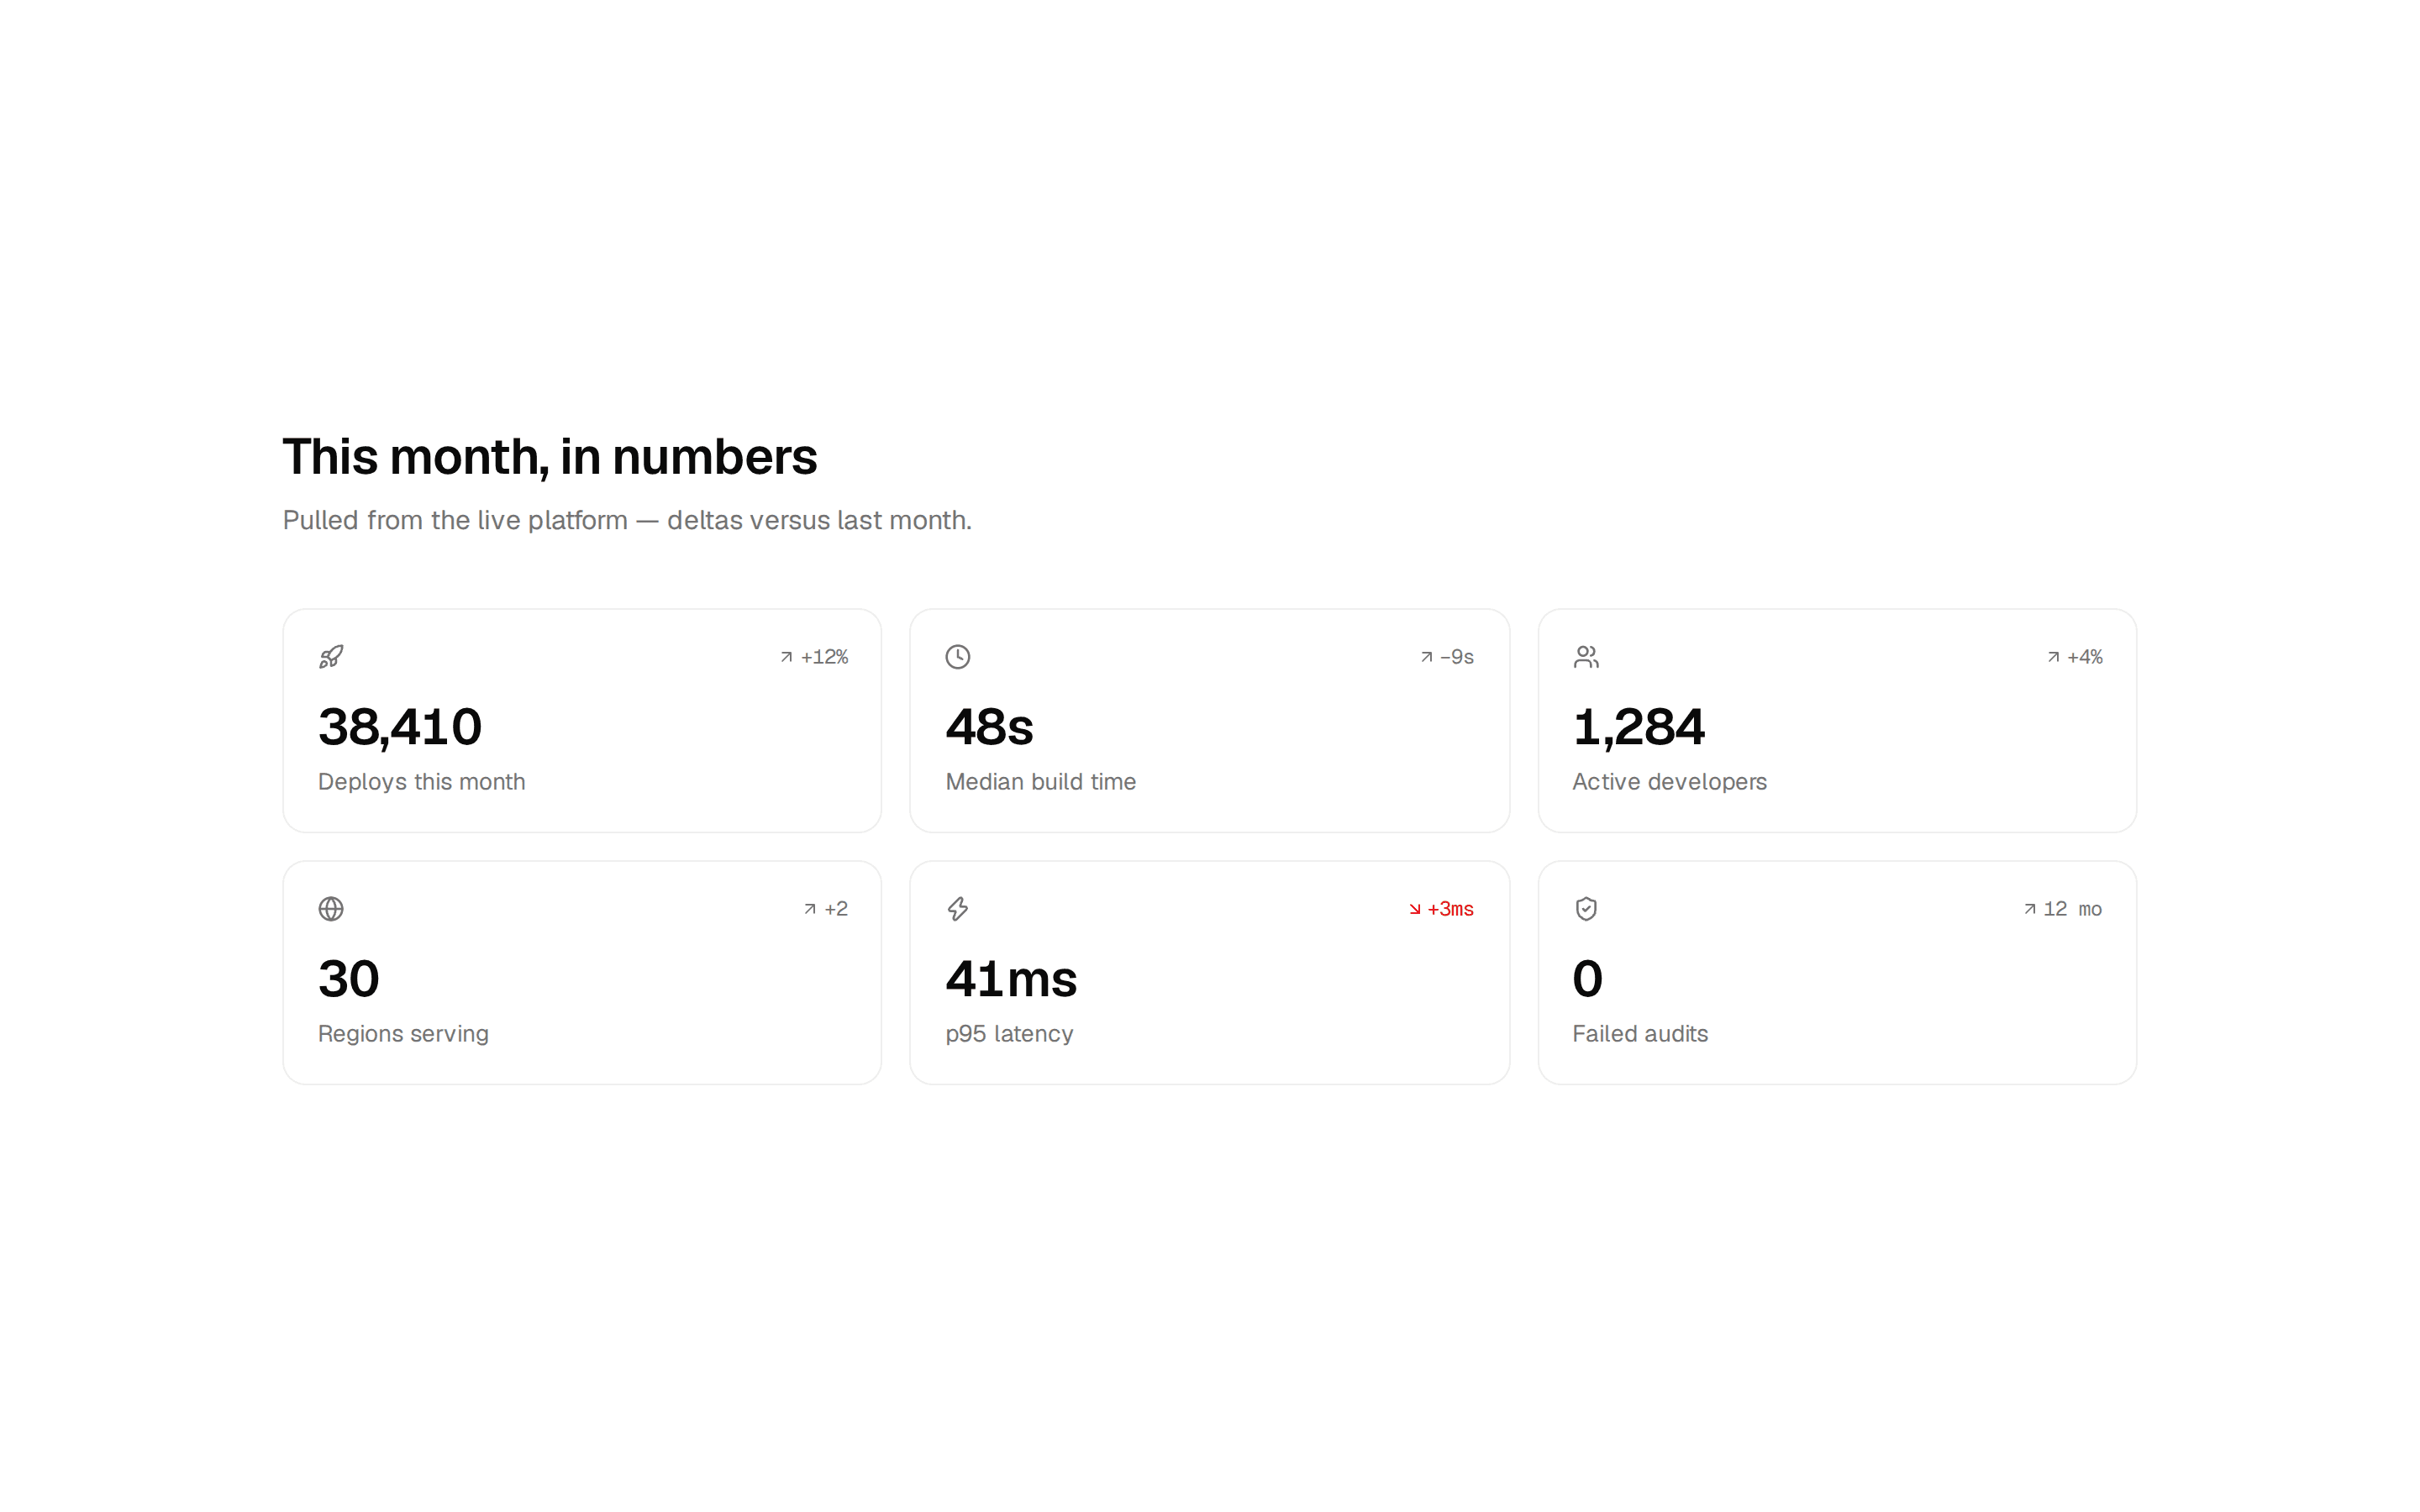
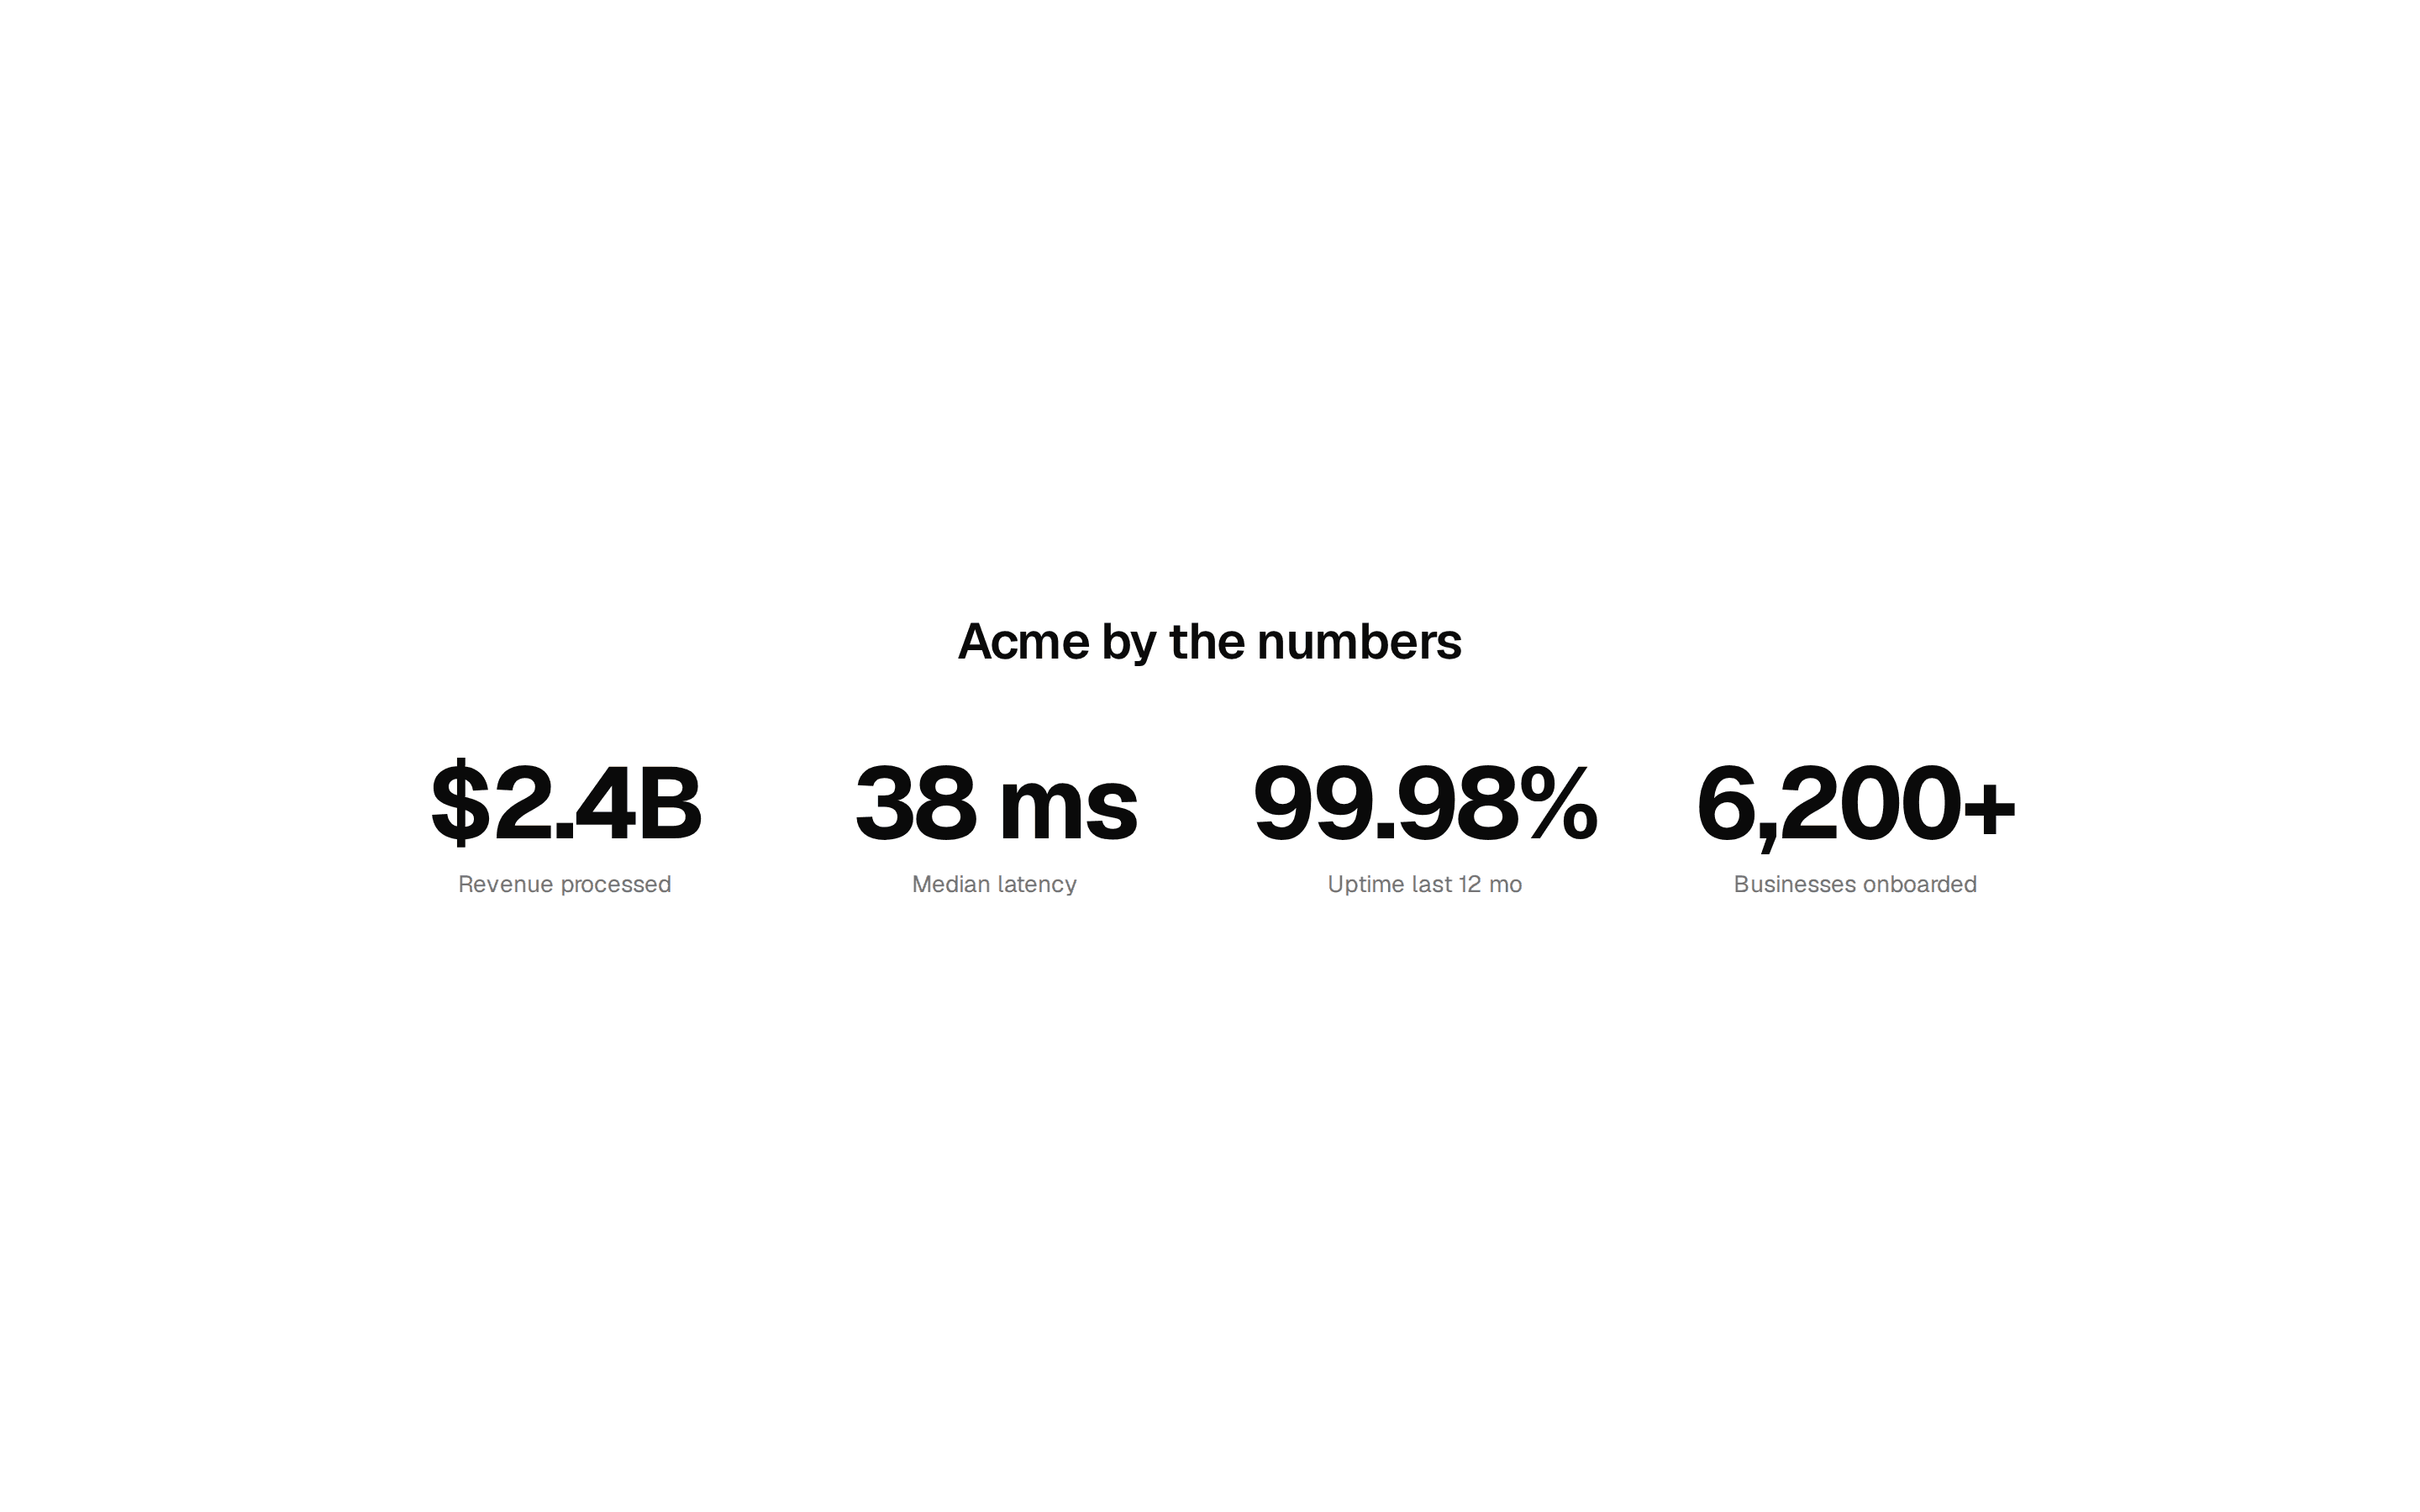
Four large numbers in a hairline grid that count up on scroll, each with a change badge, a small trend line and one line of context. Heading and copy sit above.
@ballmac
Four large numbers in a hairline grid that count up on scroll, each with a change badge, a small trend line and one line of context. Heading and copy sit above.
@ballmac
registry/ballmac/components/blocks/stats-1/stats-1.tsx
// Ballmac UI: Stats 1. https://ui.ballmac.com/blocks/stats-1
import * as React from "react"
import { ArrowUpRight } from "lucide-react"

import { NumberTicker } from "@/components/ballmac/number-ticker"
import { Sparkline } from "@/components/ballmac/sparkline"
import { cn } from "@/lib/utils"

type Stats1Item = {
  /** What is being measured. */
  label: string
  /** The number to count up to. */
  value: number
  /** Text before the number, e.g. "$". */
  prefix?: string
  /** Text after the number, e.g. "k", "%" or "M+". */
  suffix?: string
  /** Digits after the decimal point. */
  decimals?: number
  /** Change since the last period, e.g. "+18.2%". */
  delta?: string
  /** Samples for the small trend line. */
  trend?: number[]
  /** Accessible description of the trend line. */
  trendLabel?: string
  /** One short sentence of context. */
  note?: string
}

type Stats1Props = Omit<React.ComponentProps<"section">, "title"> & {
  /** Label above the heading. */
  eyebrow?: string
  /** Section heading. */
  title?: string
  /** One or two sentences beside the heading. */
  description?: string
  /** The headline numbers. Four fit best. */
  stats?: Stats1Item[]
  /** Link under the description. Pass null to hide it. */
  link?: { label: string; href: string } | null
}

const defaults: Stats1Item[] = [
  { label: "Teams on Acme", value: 12480, suffix: "+", delta: "+18%", trend: [4, 6, 5, 8, 9, 12, 11, 15, 18], trendLabel: "Teams, last 9 months", note: "Up from 10,570 a year ago." },
  { label: "Invoices paid each month", value: 3.2, suffix: "M", decimals: 1, delta: "+24%", trend: [3, 4, 4, 6, 7, 7, 9, 11, 13], trendLabel: "Invoices, last 9 months", note: "Across 41 countries." },
  { label: "Median payout time", value: 1.8, suffix: " days", decimals: 1, delta: "−0.6 days", trend: [9, 8, 8, 6, 5, 5, 4, 3, 3], trendLabel: "Payout time, last 9 months", note: "Down from 2.4 days last quarter." },
  { label: "Uptime, last 12 months", value: 99.99, suffix: "%", decimals: 2, trend: [99, 99.5, 99.9, 99.9, 99.95, 99.99, 99.99, 99.99, 99.99], trendLabel: "Uptime, last 9 months", note: "Verified by our public status page." },
]

function Stats1({
  eyebrow = "By the numbers",
  title = "Trusted with real money, every day.",
  description = "Thousands of finance teams use Acme to get paid faster and close the books without the spreadsheet scramble.",
  stats = defaults,
  link = { label: "Read the customer stories", href: "#" },
  className,
  ...props
}: Stats1Props) {
  return (
    <section data-slot="stats-1" className={cn("mx-auto max-w-6xl px-4 py-20 sm:px-6 md:py-28", className)} {...props}>
      <div className="grid gap-6 lg:grid-cols-[1.1fr_1fr] lg:items-end lg:gap-16">
        <div>
          <p className="text-muted-foreground text-sm font-medium">{eyebrow}</p>
          <h2 className="mt-3 text-3xl font-semibold tracking-[-0.035em] text-balance sm:text-4xl lg:text-5xl">{title}</h2>
        </div>
        <div>
          <p className="text-muted-foreground text-lg text-pretty">{description}</p>
          {link && (
            <a href={link.href} className="group/link focus-visible:ring-ring/50 mt-4 inline-flex items-center gap-1 rounded-md text-sm font-medium outline-none focus-visible:ring-[3px]">
              {link.label}
              <ArrowUpRight className="size-4 transition-transform group-hover/link:translate-x-0.5 group-hover/link:translate-y-[var(--bm-lift,-2px)] motion-reduce:transition-none rtl:-scale-x-100 rtl:group-hover/link:-translate-x-0.5" aria-hidden="true" />
            </a>
          )}
        </div>
      </div>

      <dl className="bg-border mt-12 grid gap-px overflow-hidden rounded-3xl border sm:grid-cols-2 lg:mt-16 lg:grid-cols-4">
        {stats.map((s, i) => (
          <div key={s.label} className="bg-card group/stat relative flex flex-col p-6 sm:p-8">
            <dt className="text-muted-foreground text-sm">{s.label}</dt>
            <dd className="mt-4 flex flex-col">
              <span className="flex items-baseline gap-2">
                <span className="text-5xl font-semibold tracking-[-0.045em] tabular-nums">
                  {s.prefix}
                  <NumberTicker value={s.value} delay={i * 0.08} format={{ minimumFractionDigits: s.decimals ?? 0, maximumFractionDigits: s.decimals ?? 0 }} />
                  <span className="text-3xl">{s.suffix}</span>
                </span>
              </span>
              <span className="mt-2 inline-flex h-5 w-fit items-center gap-1 text-sm font-medium">
                {s.delta && (
                  <>
                    <ArrowUpRight className="text-chart-2 size-3.5 rtl:-scale-x-100" aria-hidden="true" />
                    {s.delta}
                  </>
                )}
              </span>
              {s.trend && (
                <Sparkline values={s.trend} label={s.trendLabel ?? s.label} height={44} className="text-chart-1 mt-6 w-full opacity-80 transition-opacity group-hover/stat:opacity-100" />
              )}
              {s.note && <span className="text-muted-foreground mt-4 text-sm text-pretty">{s.note}</span>}
            </dd>
          </div>
        ))}
      </dl>
    </section>
  )
}

export { Stats1, type Stats1Props, type Stats1Item }