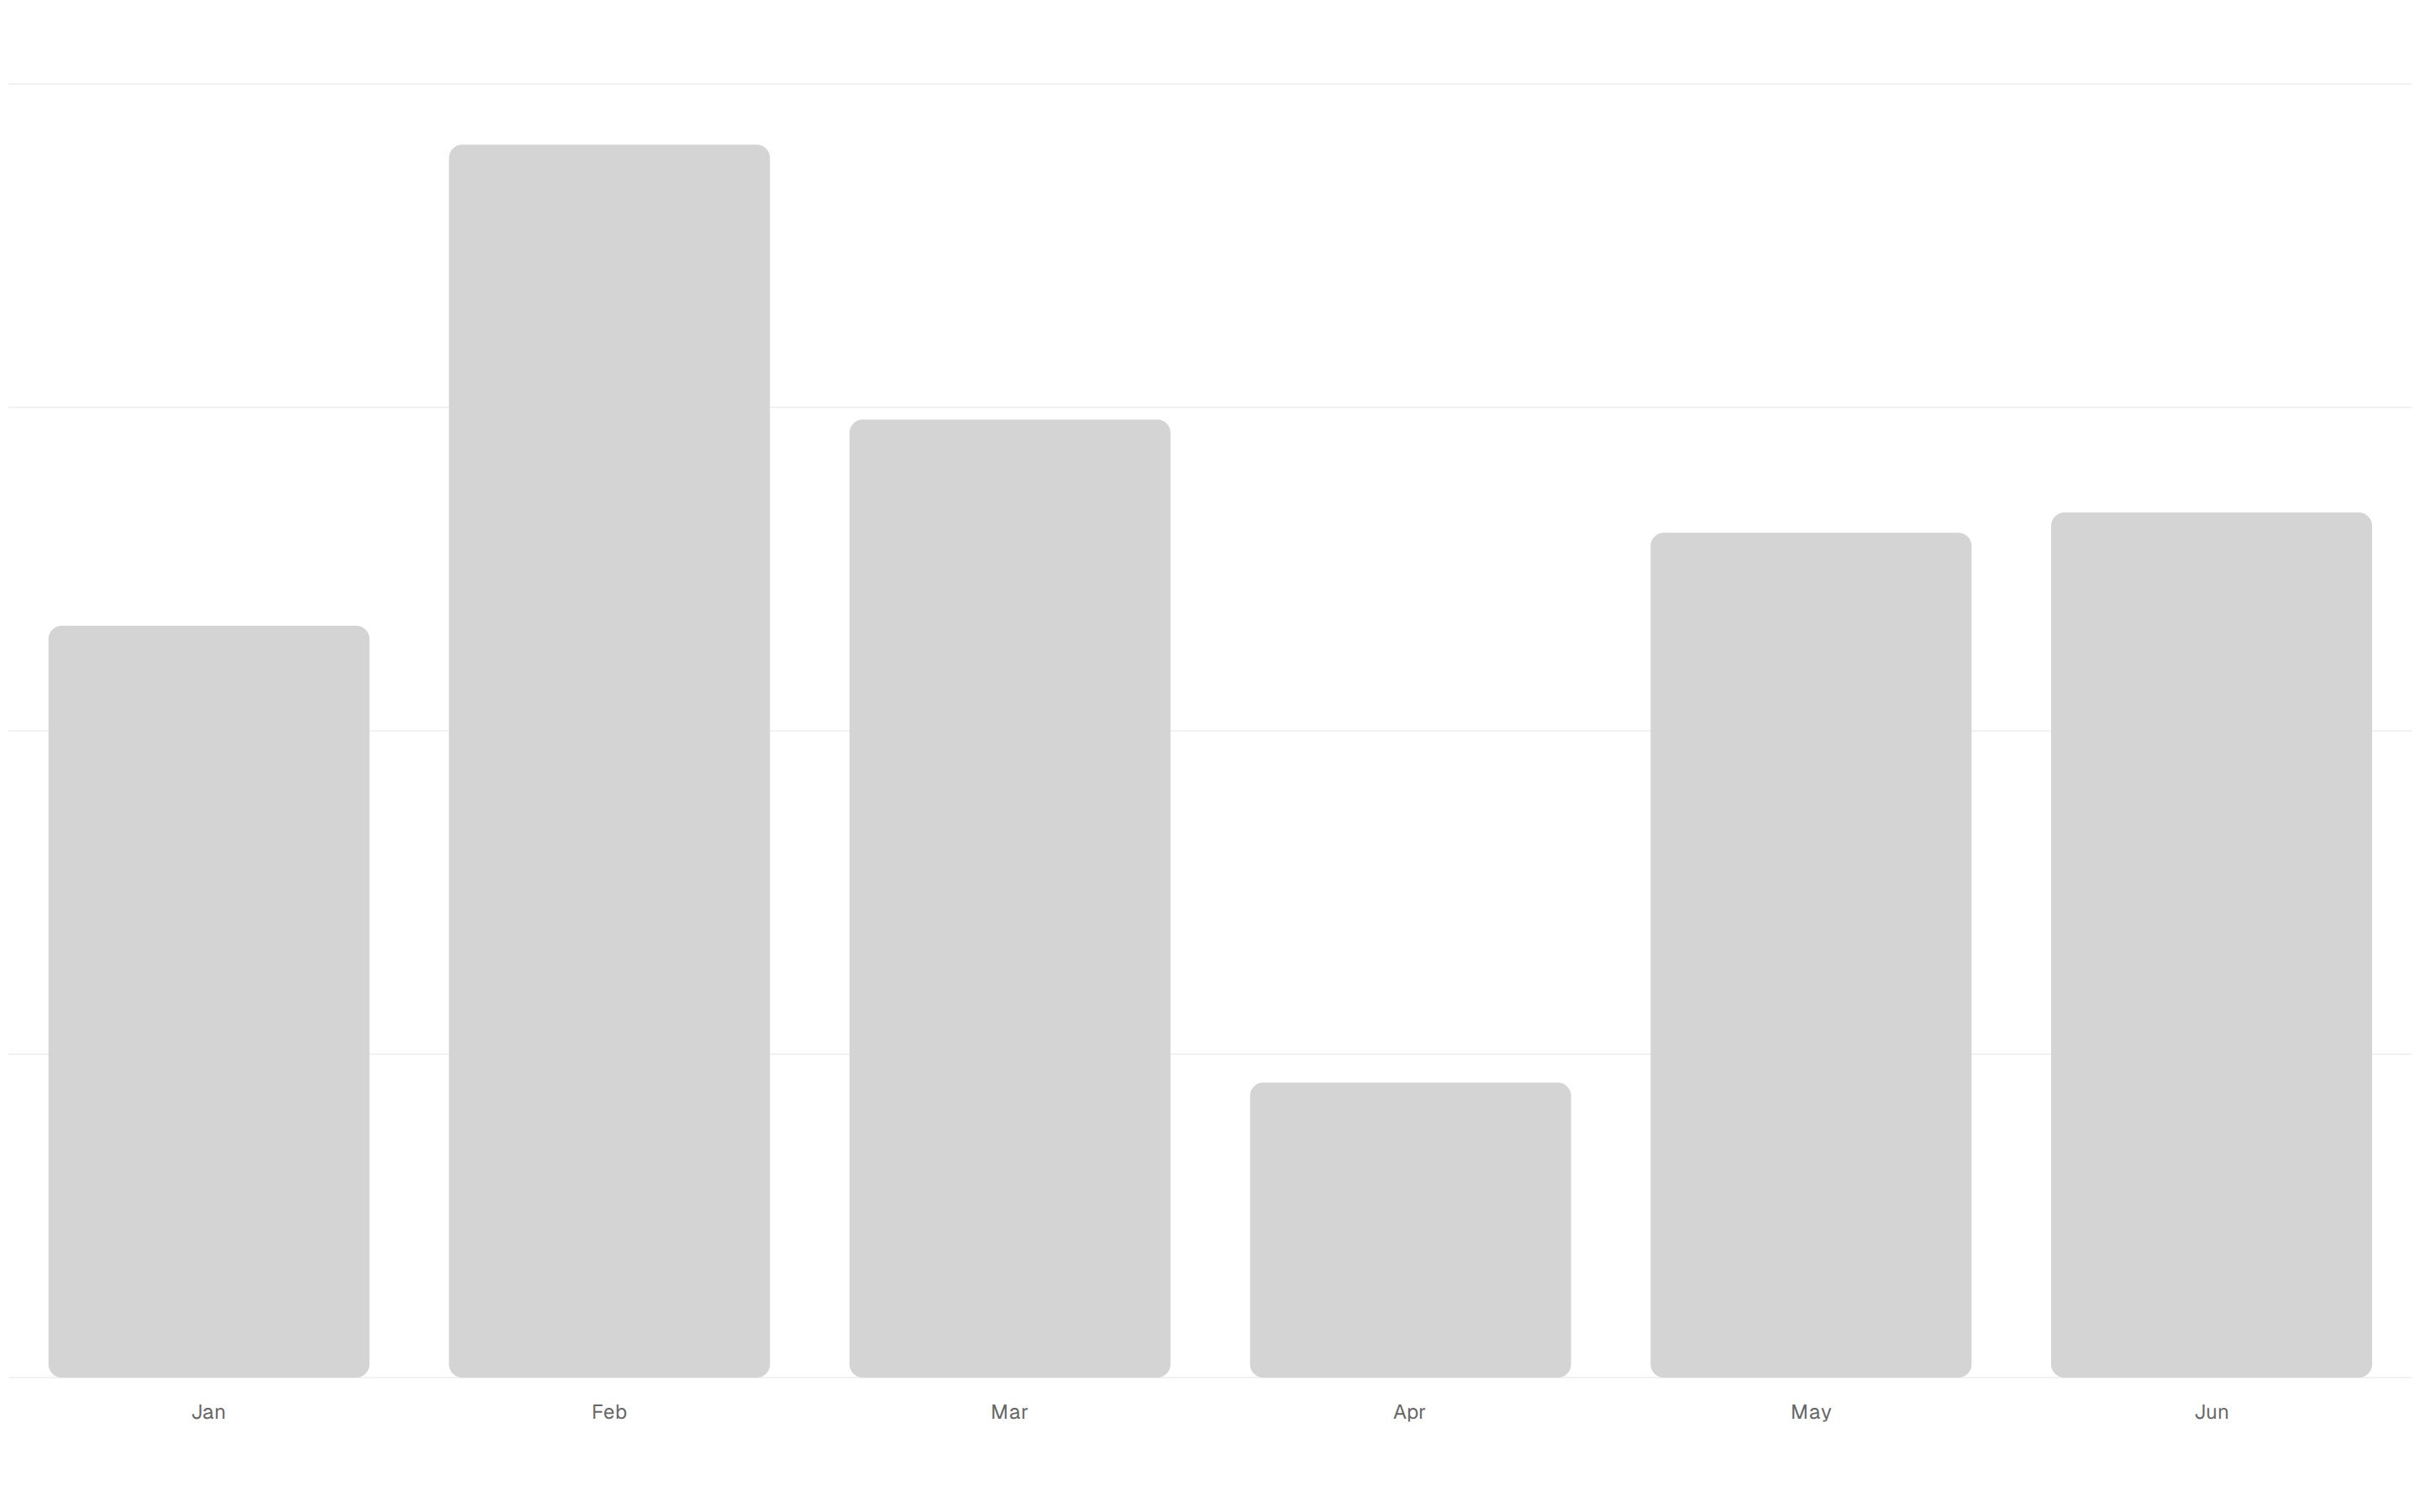
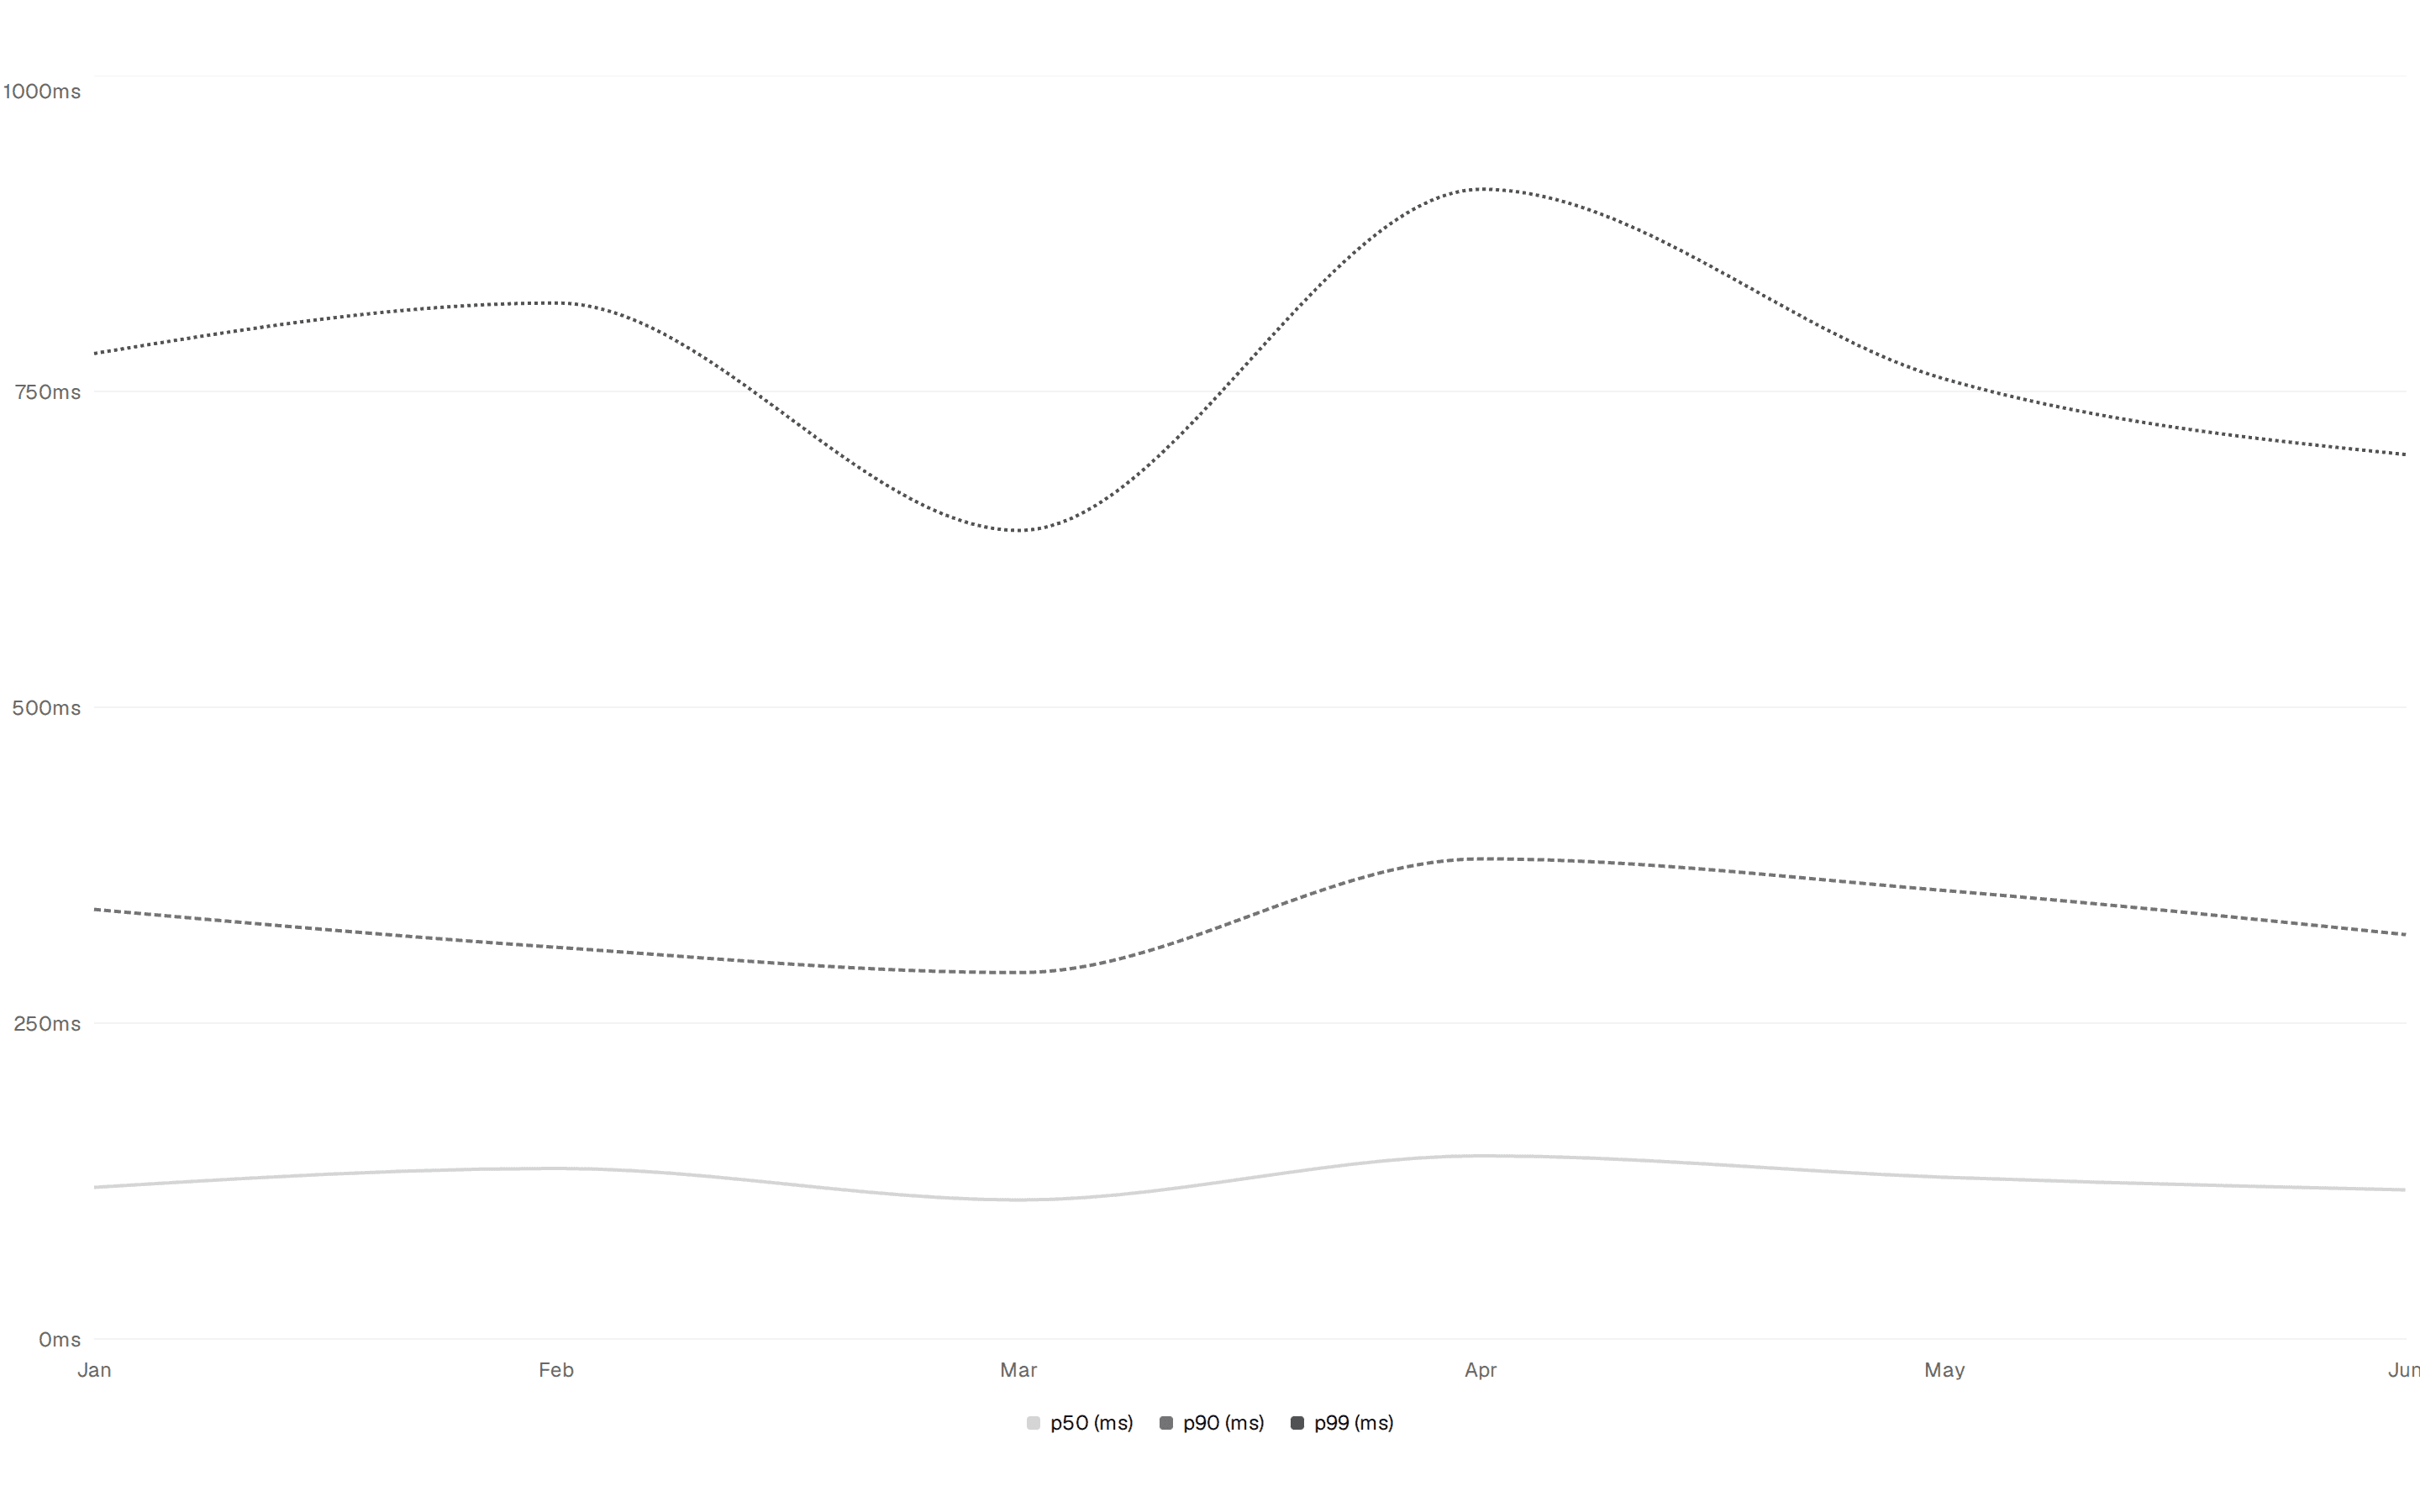
registry/default/variants/v-chart-10.tsx
"use client";

import {
  Bar,
  BarChart,
  CartesianGrid,
  ReferenceLine,
  XAxis,
  YAxis,
} from "recharts";
import {
  type ChartConfig,
  ChartContainer,
  ChartTooltip,
  ChartTooltipContent,
} from "@/registry/default/ui/chart";

const TARGET = 50000;

const chartData = [
  { month: "Jan", revenue: 38000 },
  { month: "Feb", revenue: 44000 },
  { month: "Mar", revenue: 52000 },
  { month: "Apr", revenue: 47000 },
  { month: "May", revenue: 61000 },
  { month: "Jun", revenue: 58000 },
];

const chartConfig = {
  revenue: { color: "var(--chart-1)", label: "Revenue" },
} satisfies ChartConfig;

export function Pattern() {
  return (
    <ChartContainer className="min-h-52 w-full" config={chartConfig}>
      <BarChart
        accessibilityLayer
        data={chartData}
        margin={{ left: 8, right: 48 }}
      >
        <CartesianGrid vertical={false} />
        <XAxis
          axisLine={false}
          dataKey="month"
          tickLine={false}
          tickMargin={8}
        />
        <YAxis
          axisLine={false}
          tickFormatter={(v) => `$${(v / 1000).toFixed(0)}k`}
          tickLine={false}
          width={40}
        />
        <ChartTooltip
          content={
            <ChartTooltipContent
              formatter={(v) => `$${Number(v).toLocaleString()}`}
              hideLabel
            />
          }
          cursor={false}
        />
        <ReferenceLine
          label={{
            fill: "hsl(var(--muted-foreground))",
            fontSize: 11,
            position: "right",
            value: "Target",
          }}
          stroke="hsl(var(--destructive))"
          strokeDasharray="4 4"
          y={TARGET}
        />
        <Bar dataKey="revenue" fill="var(--color-revenue)" radius={4} />
      </BarChart>
    </ChartContainer>
  );
}